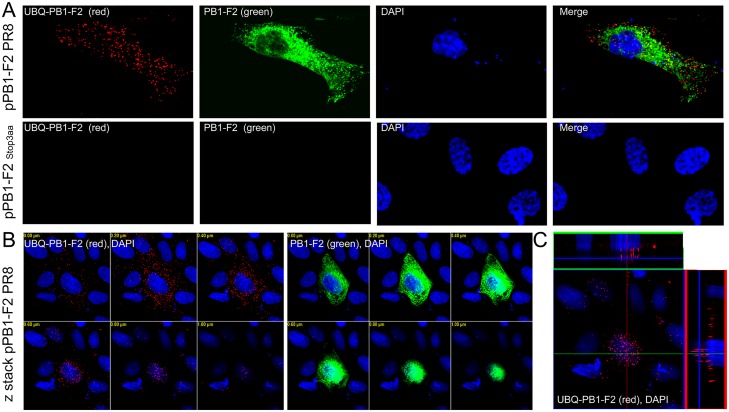
Fig 2. Detection of PB1-F2 ubiquitination using IF-PLA confocal microscopy.
MDCK cells were transfected with 1 μg of pPB1-F2 PR8 or pPB1-F2 Stop3aa as a negative control. At 24 hr p.t., (A) the subpopulation of ubiquitinated PB1-F2 (labeled UBQ-PB1-F2, red spots, upper left panel) was detected using a mixture of primary antibodies specific to UBQ and PB1-F2 and the PLA probes. In the same cell, PB1-F2 (green) was stained with a secondary antibody conjugated with FITC. Neither PB1-F2 nor UBQ-PB1-F2 was detected in the MDCK cells transfected with pPB1-F2 Stop3aa (lower row). (B) Z stacking was used to visualize UBQ-PB1-F2 (below left panel) and PB1-F2 (below middle panel) in multiple focal planes to measure the overall extent of the expression, ubiquitination and localization of UBQ-PB1-F2 or PB1-F2. (C) Orthogonal section reconstruction was applied to observe the subcellular localization of UBQ-PB1-F2 (lower right panel). The nuclei were stained with DAPI.

