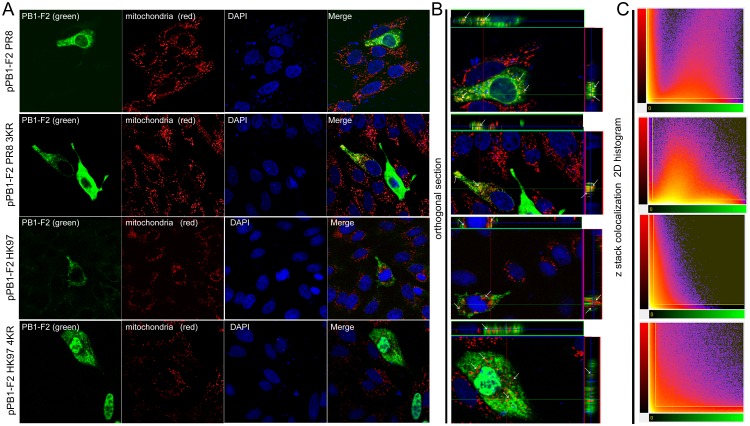
Fig 4. Subcellular localization of PR8- and HK97-derived PB1-F2 wt and the C-terminal K residue cluster mutants.
MDCK cells were transfected transiently with the respective PB1-F2 expressing plasmid (1 μg pPB1-F2 PR8/pPB1-F2 PR8 3KR/pPB1-F2 HK97/ pPB1-F2 HK97 4KR). At 24 hr p.t., the cells were stained with Mitotracker RedCMXRos according to the manufacturer’s instructions (Life Technologies), fixed and stained for the presence of PB1-F2 variants (A). mAb AG55, specific to N-terminal region of the PB1-F2, and the FITC-conjugated secondary antibody were used to stain PB1-F2 (green, left column). Mitotracker RedCMXRos was used to stain mitochondria (red, second left column). Merge of PB1-F2 and mitochondrial signals (yellow, right column) showing clearly visible colocalization in PB1-F2 PR8 and PB1-F2 PR8 3KR-positive cells. The nuclei were stained with DAPI. (B) Orthogonal section reconstruction suggests the colocalization of the PB1-F2 with mitochondria signal throughout the entire cytoplasm for PR8-derived PB1-F2 and PB1-F2 PR8 3KR, but not for PB1-F2 HK97 and PB1-F2 HK97 4KR. The images were acquired at the same exposure, pinhole and optical slice conditions. (C) Image analysis software (Bitplane Imaris) was used to generate 2D histograms of the PB1-F2 (green) and mitochondria (red) signal intensities for volume pixels (voxels) and calculating Pearson’s coefficient in colocalized volume.

