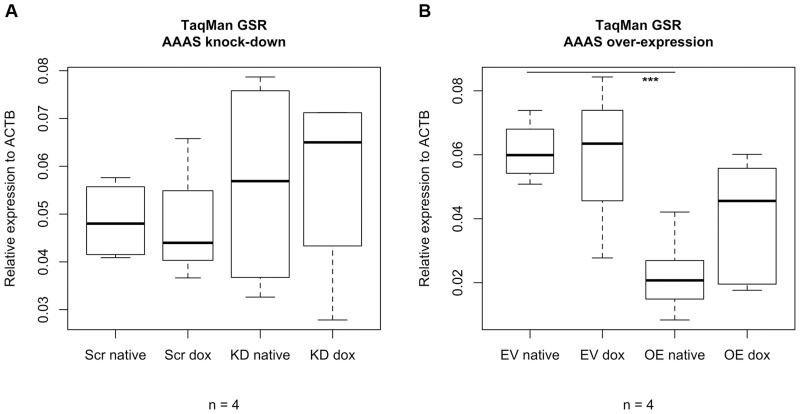
Fig 4. Box plots of TaqMan analysis of glutathione reductase.
Stably transfected NCI-H295R1-TR AAAS knock-down cells and over-expression were induced by 48 h treatment with doxycycline. GSR, glutathione reductase. Scr, scrambled shRNA. KD, knock-down. EV, empty vector (= pcDNA4/TO). OE, over-expression. Native, without doxycycline induction. Dox, doxycycline induction. n, minimum number of independent experiments. P-values: *** P<0.001. Significant differences were measured with unpaired Student’s t-Test. Boxplot widths are proportional to the square root of the samples sizes. Hundred percent boxes for native scrambled shRNA and knock-down are not shown. Whiskers indicate the range outside 1.5 times the inter-quartile range (IQR) above the upper quartile and below the lower quartile. Outliers were plotted as dots.

