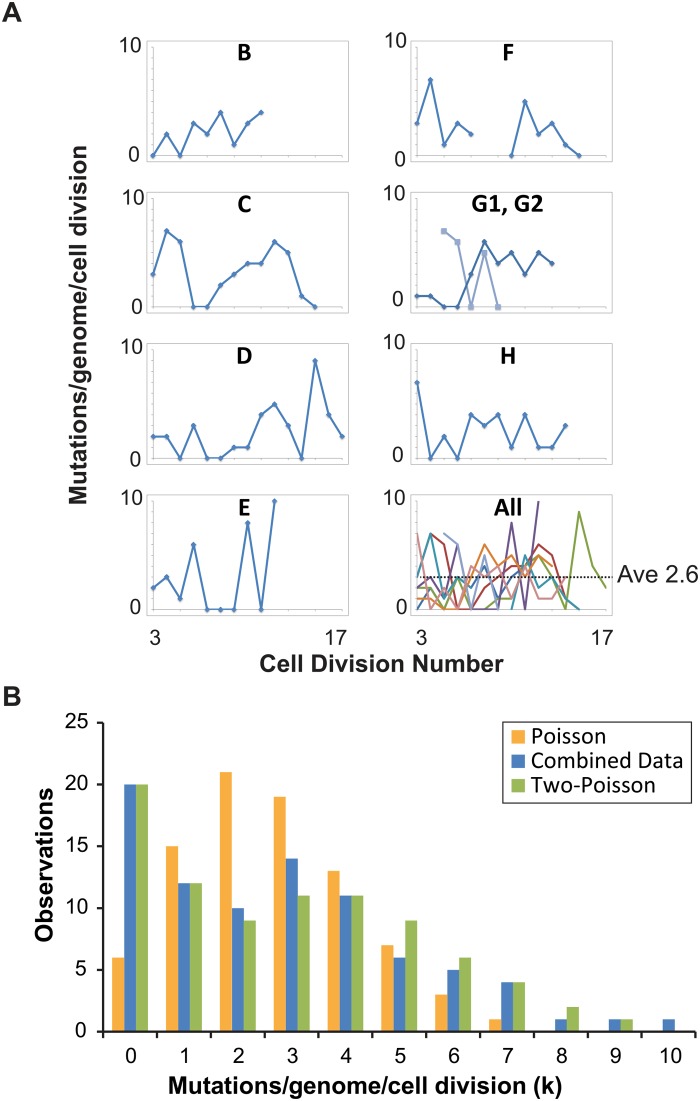
Fig 2. Distribution of single cell mutation counts in mother cells.
(A) Mutation counts of mutator cells during yeast aging. Each lineage is plotted separately, except Lineage G, whose mother cell became multi-budded, producing two distinct lineages: G1 (blue) and G2 (light blue). The gap in Lineage F is due to sequencing failure of one of the daughter clones. Bottom right, all lineages are plotted together, each represented by a different line color. (B) The observed distribution (blue bars, combined data) of mutation counts is plotted against the predicted Poisson distribution based on the average genome-wide mutation rate (2.6 x 10⁻⁷ mutations/bp/cell division) (orange bars, Poisson Model) and a composite distribution resulting from two overlapping Poisson distributions with mutation rates of 4 x 10⁻⁸ (contributing 35%) and 4 x 10⁻⁷ (contributing 65%) mutations/bp/cell division (green bars, Two-Poisson Model).

