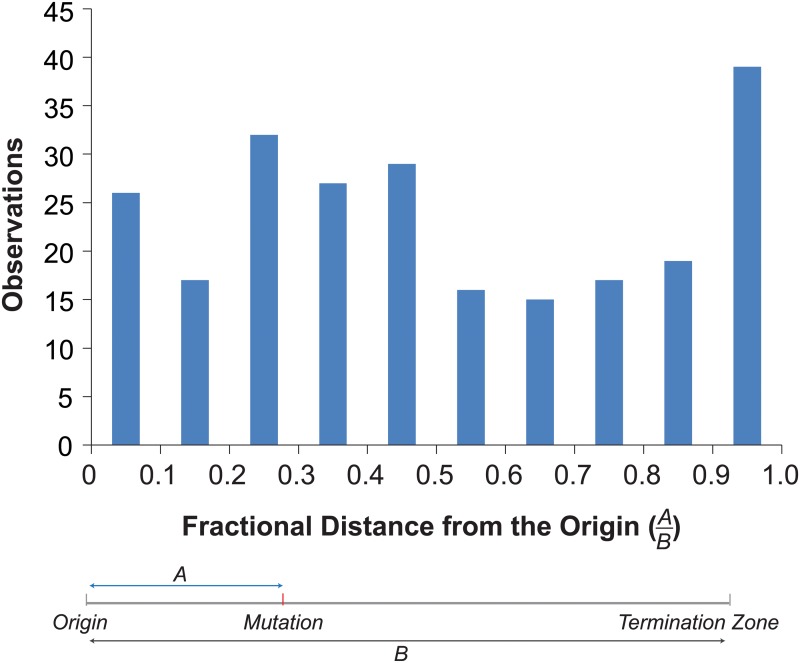
Fig 4. Distribution of mutations within replicons.
Top. Histogram of the fractional distances of mutations to the nearest origin using the replicons defined by Raghuraman et al. [39] (see S3 Dataset). Bottom. Schematic shows how fractional distances are determined.

