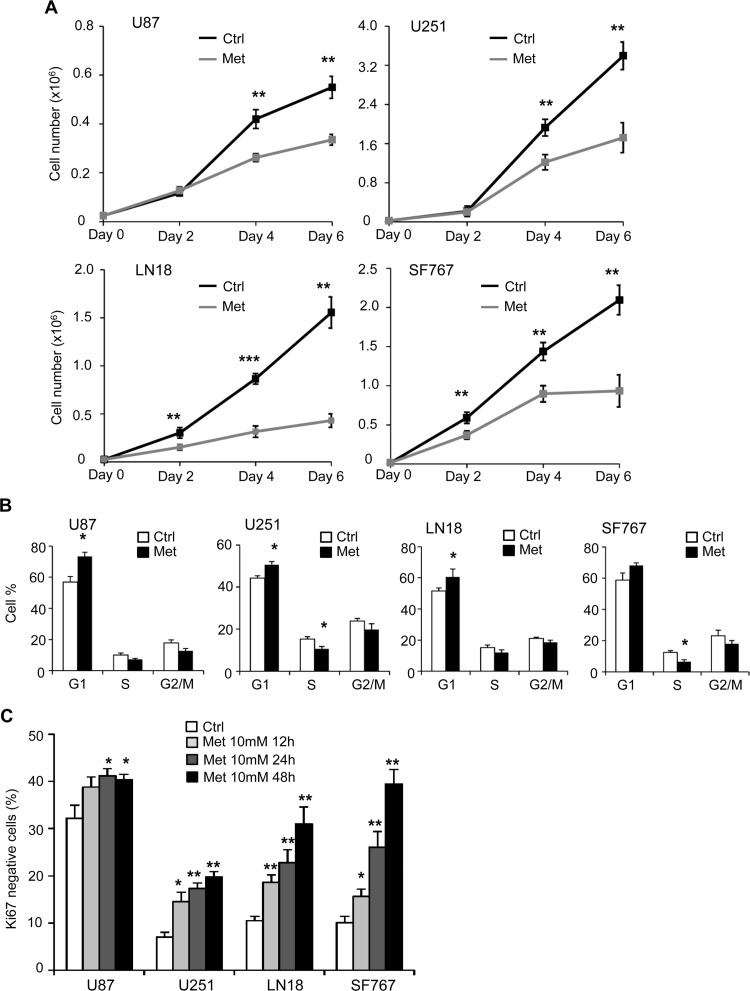
Fig 2. Metformin inhibits glioma cell proliferation and induces a transition in G0.
(A) Proliferation assays performed with U87, U251, LN18 and SF767 cells show a decreased cell number in presence of metformin (black curve, Ctrl: PBS vehicle control; grey curve, Met: metformin 10mM) (*p<0.05, **p<0.01, ***p<0.001 Met vs. Ctrl, n = 3). (B) Quantification of cell cycle distribution of GB cells, using flow cytometry and PI, staining 48hrs after treatment. Metformin (Met) induces decreased cell number in S phase and increased cell number in G1 phase compared to control cells (Ctrl). (C) Quantification of GB cells in G0 phase, using flow cytometry and Ki67/PI staining, 12hrs, 24hrs and 48hrs after treatment. Metformin significantly increases the number of cells in G0 phase (*p<0.05, **p<0.01 Met compared to Ctrl, n = 3).

