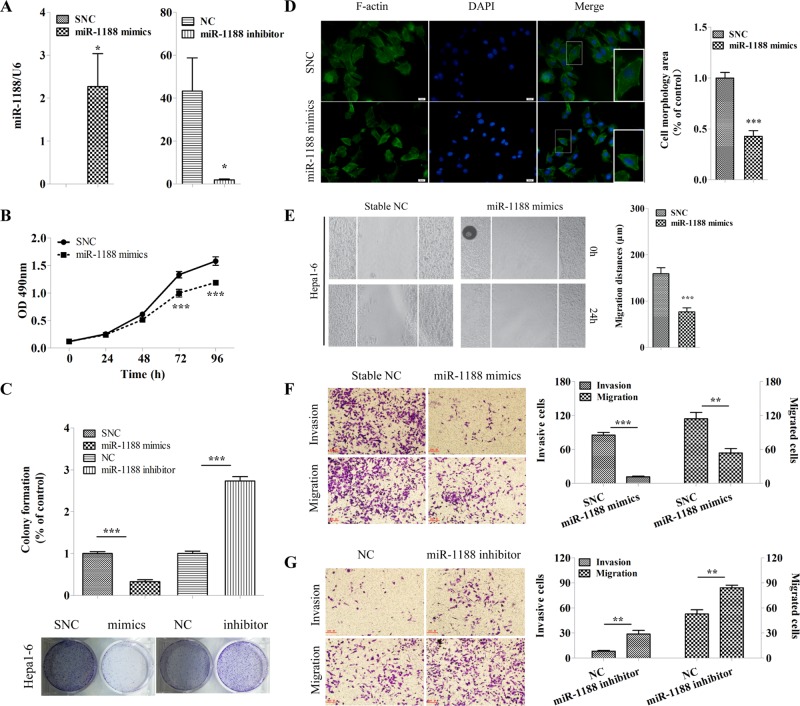
FIGURE 2:
MiR-1188 suppressed cell proliferation, migration, and invasion in Hepa1-6 cells in vitro. (A) qRT-PCR analysis showed the relative levels of miR-1188 after Hepa1-6 cells were transfected with mimics or inhibitor. Relative miRNA levels were determined after normalization with U6. (B) Representative growth curves corresponding to Hepa1-6 cells transfected with SNC or miR-1188 mimics. (C) Colonies grown from Hepa1-6 cells transfected with mimics, SNC, inhibitor, or NC were counted. Percentage of control means the ratio of the experimental group to the control group, with each control defined at a value of 1 for statistical analysis. (D) Immunofluorescence staining of Alexa Fluor 488–conjugated phalloidin, which is a high-affinity probe for F-actin (green), in Hepa1-6 cells transfected with SNC or mimics for 24 h (viewed by fluorescence microscope). Enlarged images of the boxed area are shown in the bottom right corner of the merge image; scale bars, 20 μm. Cell areas (morphology) were calculated and analyzed by image analysis. Ten randomly selected regions were analyzed. (E) Confluent monolayers of cells transfected with SNC or mimics were wounded and incubated for an additional 24 h. The migration distances were calculated. (F, G) Migration and invasion of Hepa1-6 cells transfected with SNC, mimics, NC, or inhibitor. Error bars represent the SE obtained from three independent experiments; *p < 0.05, **p < 0.01, ***p < 0.001.

