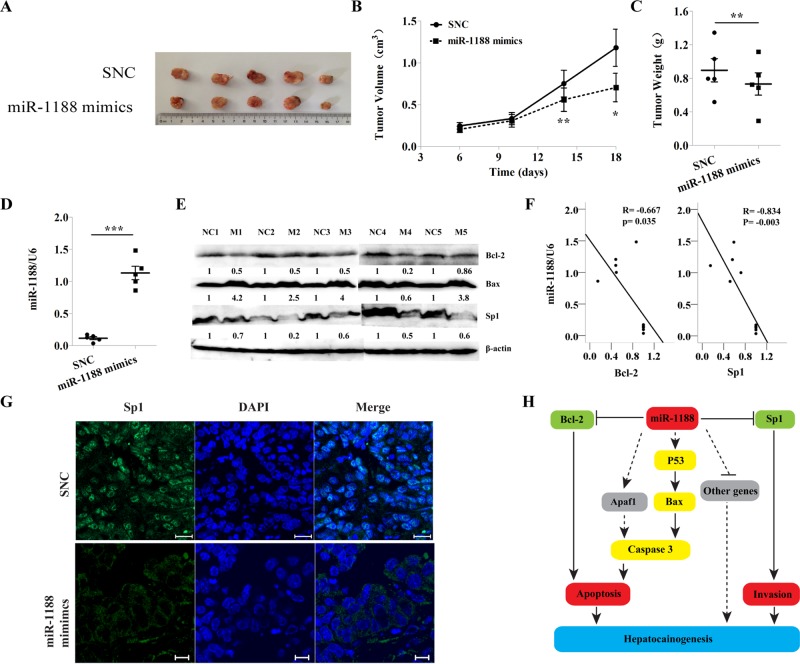
FIGURE 6:
MiR-1188 inhibited hepatoma tumor growth in vivo. (A) Hepa1-6 cells were injected subcutaneously into the left and right flanks of nude mice and the transplanted tumors harvested (n = 5). (B, C) The weight and volume of the harvested transplanted tumors. (D) The expression of miR-1188 in the tumors as found by qRT-PCR. (E) The expression of Bax, Bcl-2, and Sp1 in the tumors as revealed by immunoblot. (F) Inverse correlation between miR-1188 and Sp1 or Bcl-2 protein level in the tumors. Statistical analysis was performed using Pearson's R, and R and P values are as shown. (G) Immunohistochemistry showed the Sp1 expression (viewed by confocal microscopy). DAPI staining (blue) was used to visualize nuclei; Scale bars, 20 μm. (H) Schematic diagram showing the signaling network in which miR-1188 is involved. Error bars represent the SE obtained from three independent experiments; *p < 0.05, **p < 0.01, ***p < 0.001.

