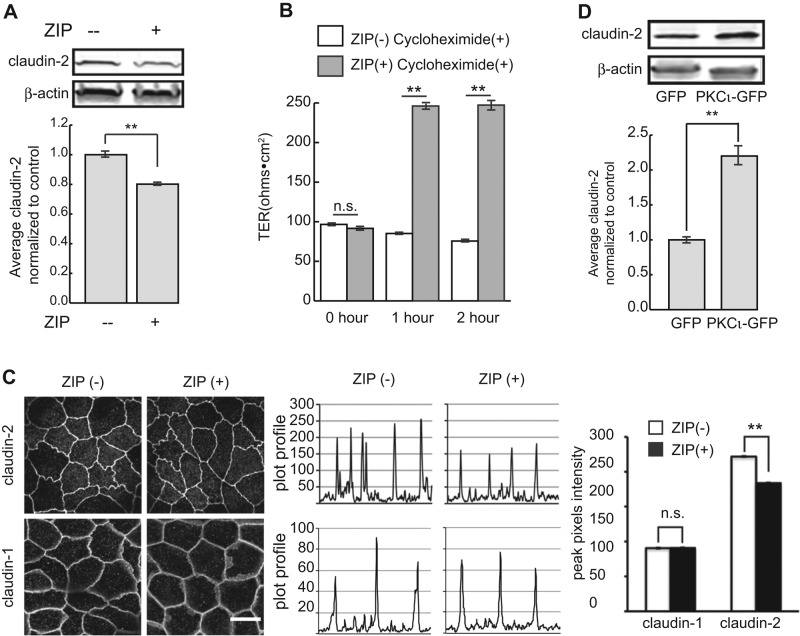
FIGURE 3:
(A) MDCK II cells were lysed after ZIP treatment and claudin-2 protein levels analyzed. β-Actin was used as loading control (top). Quantification shows claudin-2 protein level slightly but significantly decreased (bottom). (B) TER of confluent cell monolayers was measured after 2 h of ZIP treatment in the presence of cycloheximide. ZIP treatment causes a dramatic increase in TER, but this is unaffected by cycloheximide. (C) Less claudin-2 localizes to the cell–cell junction after ZIP treatment. Random lines were drawn across cell–cell junctions, and the plot profiles were analyzed with ImageJ (middle). Pixel intensity of the peaks was averaged and plotted (right). Pixel intensity of claudin-2 at junctions of treated cells is significantly lower than in controls. In contrast, junctional localization of claudin-1 was not different in untreated and treated cells. Scale bar, 10 μm. (D) MDCK cells were transfected with green fluorescent protein (GFP) or PKCι-GFP. Claudin-2 protein levels were analyzed by immunoblot. β-Actin was used as loading control (top). Claudin-2 protein level increases more than twofold in cells overexpressing PKCι-GFP (bottom). Error bars represent SEM; ** p< 0.001.

