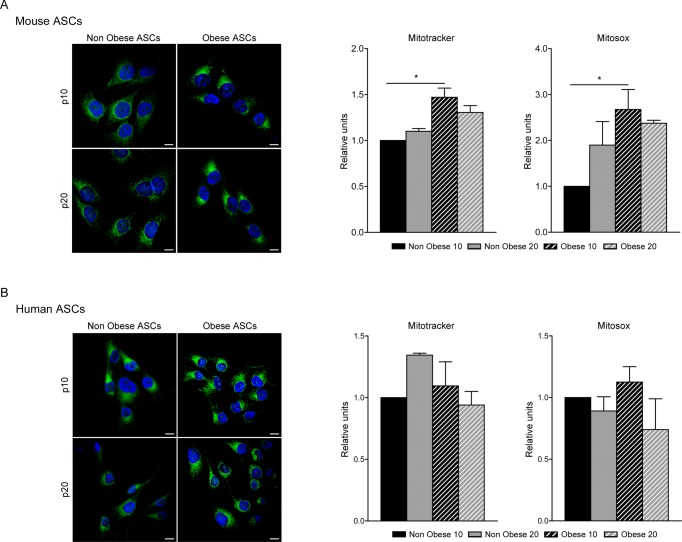
Fig 2. Mitochondrial abundance in ASCs.
Confocal microscopy of Mitotracker Green staining in murine (A) and human (B) ASCs. One representative image out of three independent experiments is shown. Bar, 10 μm. Mitochondria quantification by flow cytometry with Mitotracker Green and ROS production with Mitosox Red in murine (A) and human ASCs (B). Data represent mean±SEM from three independent experiments. * P < 0.05.

