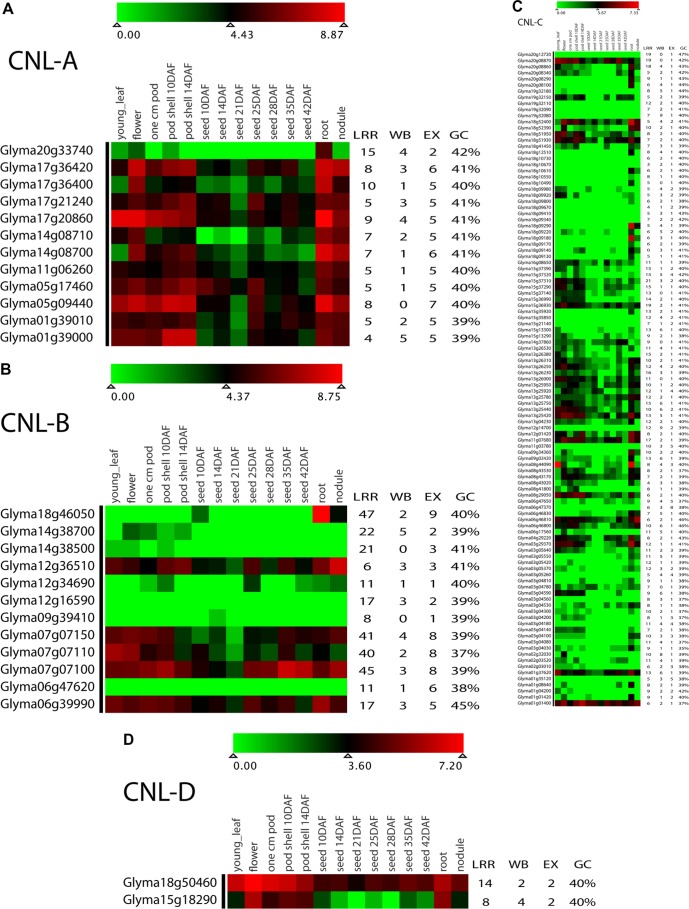
Figure 4.
Expression profile for soybean CNL-A, CNL-B, CNL-C, and CNL-D genes visualized as heatmaps in panel A, B, C and D, respectively.
Notes: Heatmaps were constructed using log2-transformed data for the CNL genes in 14 tissue types shown at the top. The number of LRRs, WBOX (WB) regulatory factors, number of exons (EX), and the G + C content of the coding sequence are shown on the right.

