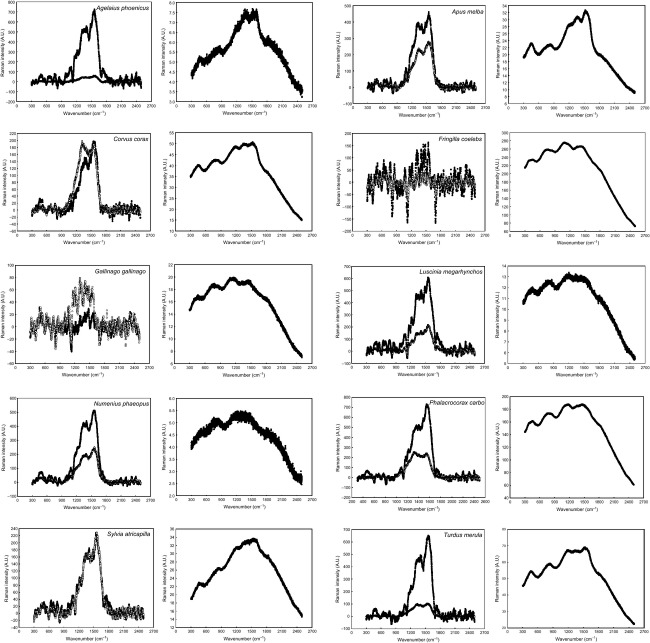
Figure 1.
Spectra of melanins in the feathers of 10 species of birds obtained by dispersive Raman spectroscopy with laser excitation at 780 nm. In each pair of graphs, the left one corresponds to this study and the right one corresponds to the study by Thomas et al. (2013). All spectra correspond to eumelanin excepting those of F. coelebs and G. gallinago that correspond to pheomelanin. Raw spectral data without baseline correction nor smoothing are shown. Solid symbols: barbs, open symbols: barbules.

