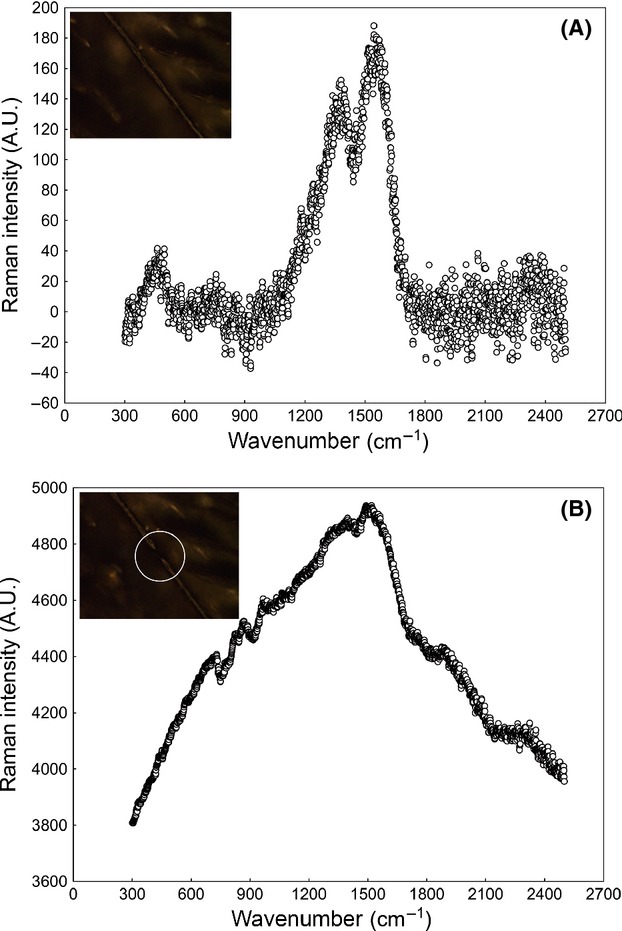
Figure 2.

(A) Raman spectrum of eumelanin obtained from a barb using a laser power of 2 mW. (B) Fluorescence disturbance obtained when the same barb was broken due to an excess laser power (10 mW). Inserts are confocal microscope images showing the barb before (A) and after (B) breakage. The white circle in B indicates the point where the barb was broken. The barb corresponds to a dark gray feather from the back of a Northern goshawk Accipiter gentilis. Raw spectral data without baseline correction nor smoothing are shown.
