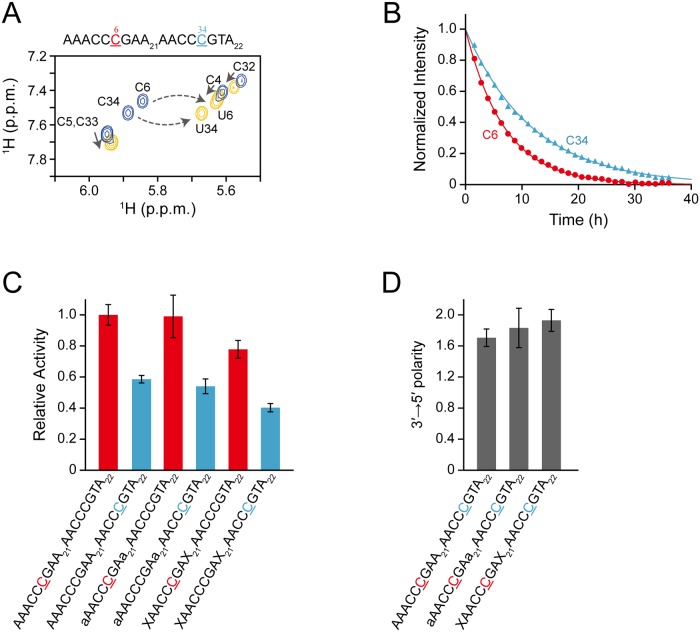
Fig 3. Real-time monitoring of deamination reactions for DNA oligonucleotides having two CCC hotspots linked by either a deoxyribonucleotide, ribonucleotide, or abasic deoxyribonucleotide.
(A) TOCSY spectra of AAACCCGAA21AACCCGTA22 (C to U conversion occurs at underscored C6 and C34) recorded before (blue) and 36 hours (yellow) after addition of A3G CD2 are superimposed. Signals of C6 and C34 are each connected with those of U6 and U34 by a broken arrow. Note that the signals of C4, C5, C32, and C33 are also perturbed (solid arrows) due to the aforementioned C to U conversion. (B) The time course of the intensity change was monitored for C6 and C34 of the ssDNA shown in (A). (C) Relative activities toward C6 and C34 of AAACCCGAA21AACCCGTA22, aAACCCGAa21AACCCGTA22, and XAACCCGAX21AACCCGTA22 (C6 and C34 are underscored), where "a" and "X" are an adenine ribonucleotide and an abasic deoxyribonucleotide, respectively. Relative activity was defined as the ratio of the rate constant obtained for C6 or C34 of each substrate to that obtained for C6 of AAACCCGAA21AACCCGTA22. (D) The 3′→5′ polarity of A3G's deamination activity is defined as the ratio of the rate constant obtained for C6 to that obtained for C34 for each substrate.

