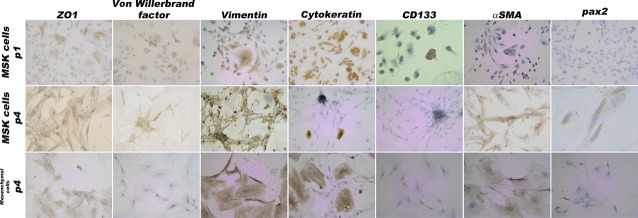
Fig 6.

Immunophenotype of MSK and control mesenchymal cells. Light microscopy images (100× and 200×) of MSK cells at p1 and p4 and of control cells at p4; at these time-points, the two types of cells were extremely similar. In total, 100% were positive for vimentin and ZO1, 80% were positive for αSMA and 100% were negative for CD133. At p1, 90% of the MSK cells were positive for cytokeratin and vimentin; 10% were positive for von Willebrand factor; and 40% were positive for ZO1, thus indicating phenotypic heterogeneity. The figures and percentages are representative of the results of three experiments.
