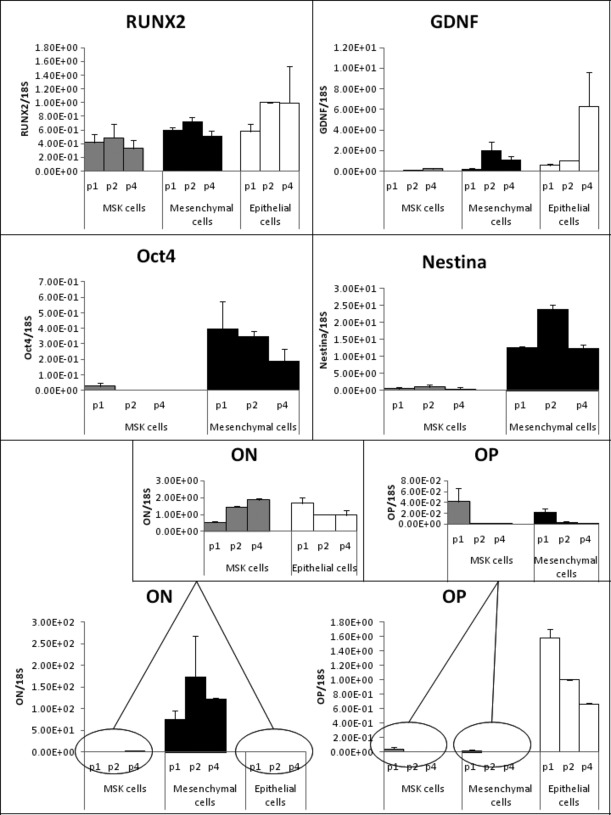
Fig 9.
mRNA profiles of MSK and control cells. The mRNA levels of six different genes at different passages (p1, p2 and p4) detected by quantitative comparative RT-PCR (Runx2, GDNF, OCT4 and Nestin) and by real-time RT-PCR (ON: osteonectin; OP: osteopontin) are shown as ratios of the target genes to reference gene and normalized to p2 control epithelial cells. The results represent the mean ± SD of three separate RT/PCR experiments.

