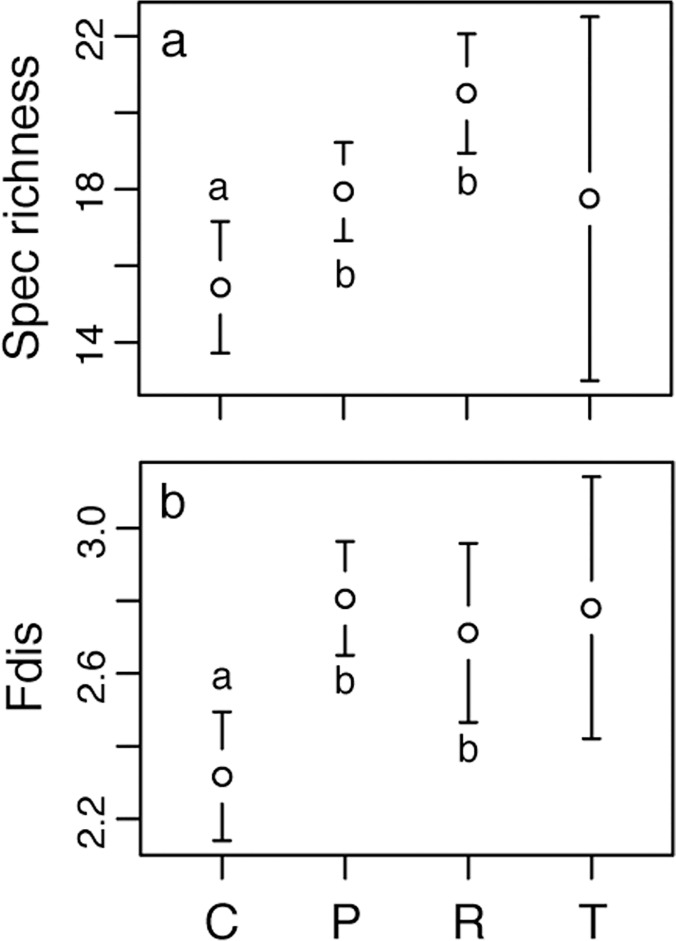
Fig 2. Number of species (a) and functional diversity (Fdis) (b) for each treatment.
Bars show 95% CI. Letter above/below bars represent the result of statistical testing. Different letters refers to significant differences. Target was not included in the tests due to the low number of replicates. C refers to control plots, P to ploughed plots, R to rotavated plots, T to target plots. There were 4 replicates for target plots and 16 for the other treatments.

