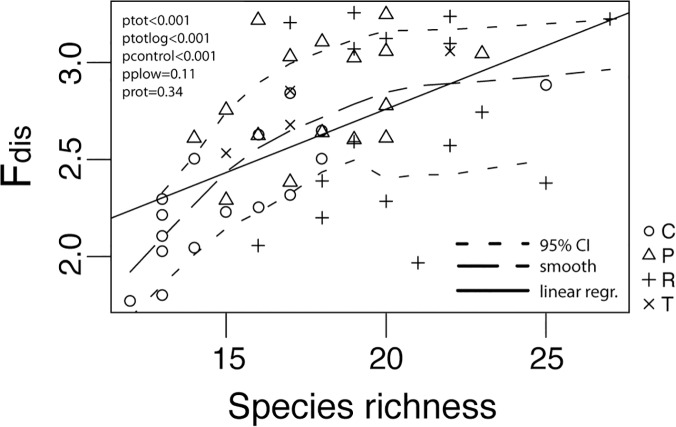
Fig 3. Relationship between plant species richness and functional diversity (Fdist).
Linear regression is shown although a log-linear relationship had slightly higher degree of explanation because of the ease of interpretation. Broad dashed line shows smoothed relationship, and small dashed line show 95% CI to the smoothed line. C refers to control plots, P to ploughed plots, R to rotavated plots, T to target plots.

