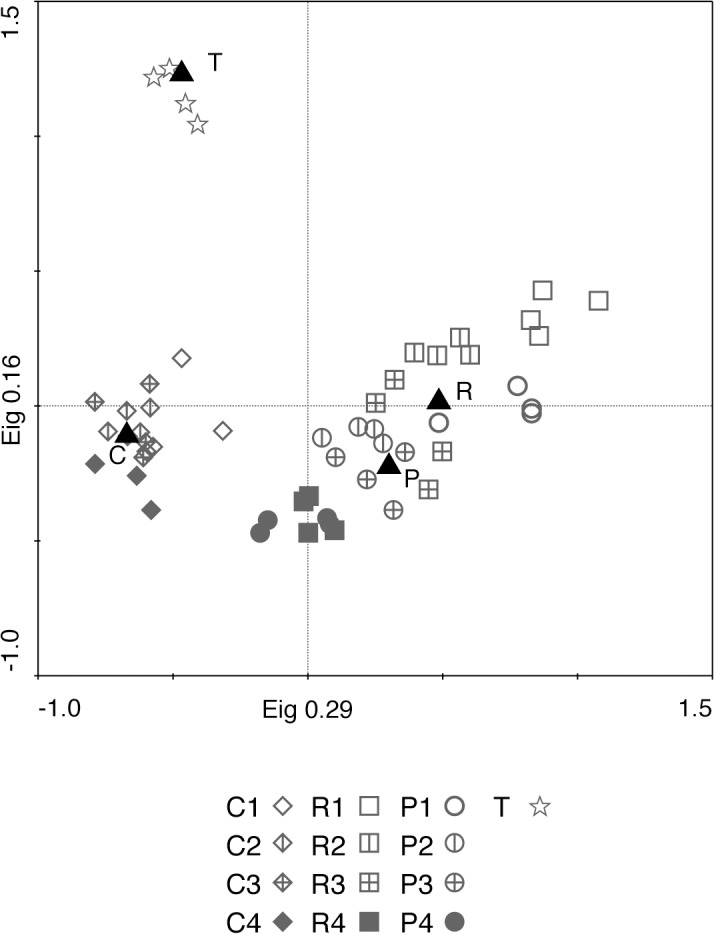
Fig 4. PCA plot showing the plant community composition in each of the treatments and all years.

Numbers in legend refers to year after disturbance (1–4) for each treatment (C for control plots, P for ploughed plots, R for rotavated plots and T for target plots), black triangles denoted mean for each type of treatment (C, P and R) and for target plots (T).
