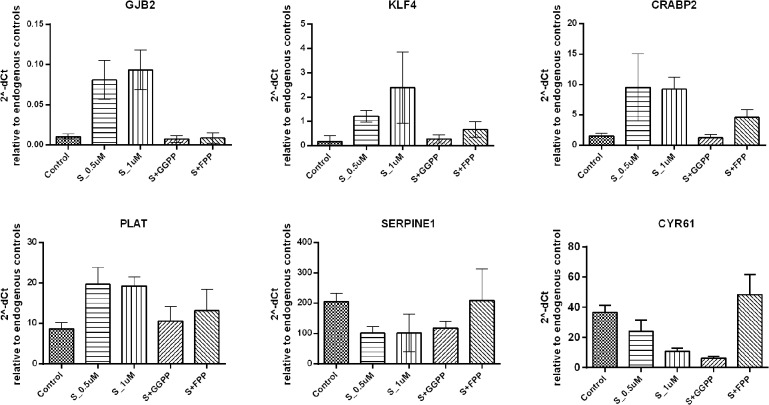
Fig 2. Validation of microarray experiments by quantitative real time PCR (qRT-PCR) for selected genes.
The graph shows the median of 2^-dCt values, agains the geometric mean of the dCt of two reference genes. Control refers to MSC exposed only to the vehicle (absolute ethanol). S_1Um and S_5uM: MSC treated with simvastatin in the concentration of 1μM and 5μM, respectively. S+FPP and S+GGPP, MSC treated with 5μM of simvastatin and 5μM of FPP (15-carbon farnesylpyrophosphate) and 5μM of GGPP (20-carbon geranylgeranyl pyrophosphate), respectively. S+M, MSC treated with 5μM of simvastatin and 100μM of activated L-Mevalonate (M).

