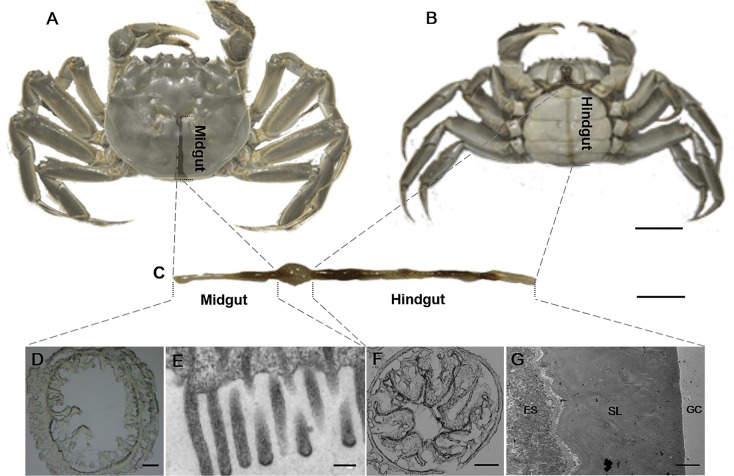
Fig 3. The location (A, B) and structure (C-G) of CMC gut.
The cross-sections of CMC intestines were analyzed with light microscope (D, F) and with transmission electron microscope (E, G). ES represents endothelial cell surface, SL represents secretary layer, and GC represents gut cavity. Scale bar = 1.0 cm (A, B), 2.0 cm (C), 100 μm (D, F), 0.25 μm (E), and 5.0 μm (G).

