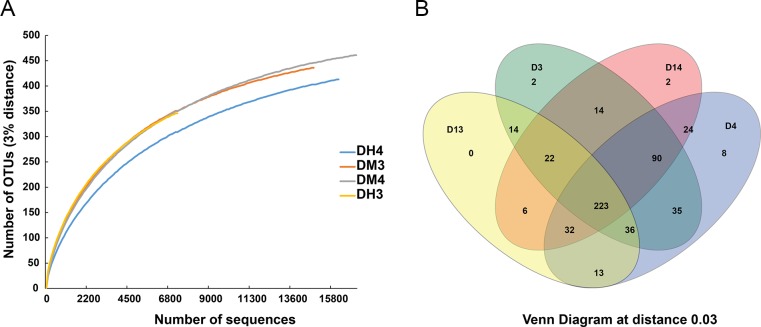
Fig 8. Rarefaction curves (A) and Venn diagram (B) of the bacterial 16S rRNA gene metagenomic data sets from the intestine of CMCs at 97% similarity.
The rarefaction curves for all the samples reached the near plateau phase, representing good sampling depth. Most of the abundant species were common to all the samples. DMx and DHx indicate midgut and hindgut, respectively. The samples were obtained from the same crab when x is of the same number.

