
Fig 5. Effects of carbon sources on degradation of biphenyl (100 mg L−1) by HC3.
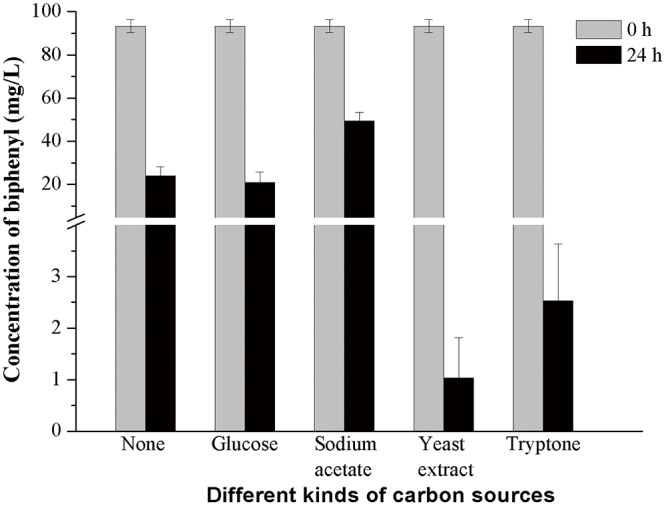
Control group: active cells 10% (v/v), no additional carbon source. Other groups: active cells 10% (v/v), glucose, sodium acetate, yeast extract or tryptone 1 g L-1. Error bars represent mean ± standard deviation (n = 3).