
Fig 7. The variation trends of 3-CBA in 3-CB degradation system at 0–5 h, quantitatively analyzed by GC-MS.
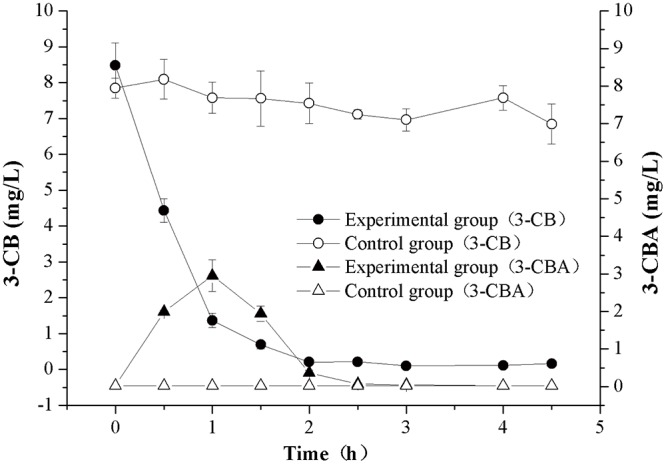
Initial concentration of 3-CB was 10 mg L-1. In control groups, HC3 cells were inactivated twice by autoclaving at 121°C for 30 min. The derivatization reagent was BSTFA-TMCS (99:1, v/v). Error bars represent mean ± standard deviation (n = 3).