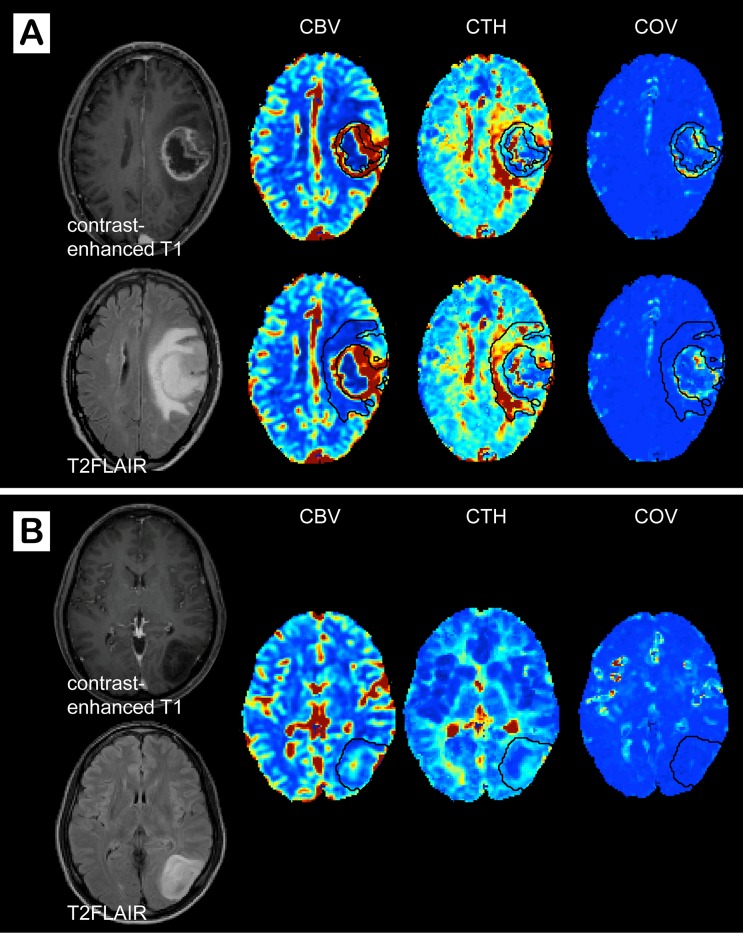
Fig 2. Image examples of a high-grade and a low-grade glioma.
Contrast-enhanced T1, T2FLAIR, cerebral blood volume (CBV), capillary transit time heterogeneity (CTH), and coefficient of variance (COV) maps in a patient with (A) a glioblastoma and (B) an astrocytoma grade 2. The enhancing tumor and the peri-focal edema are outlined with black lines on the parameter maps. (A) The glioblastoma shows increased COV in the enhancing part and high CTH in the peri-tumoral edema, whereas (B) the astrocytoma grade 2 is characterized by low CBV, CTH, and COV.

