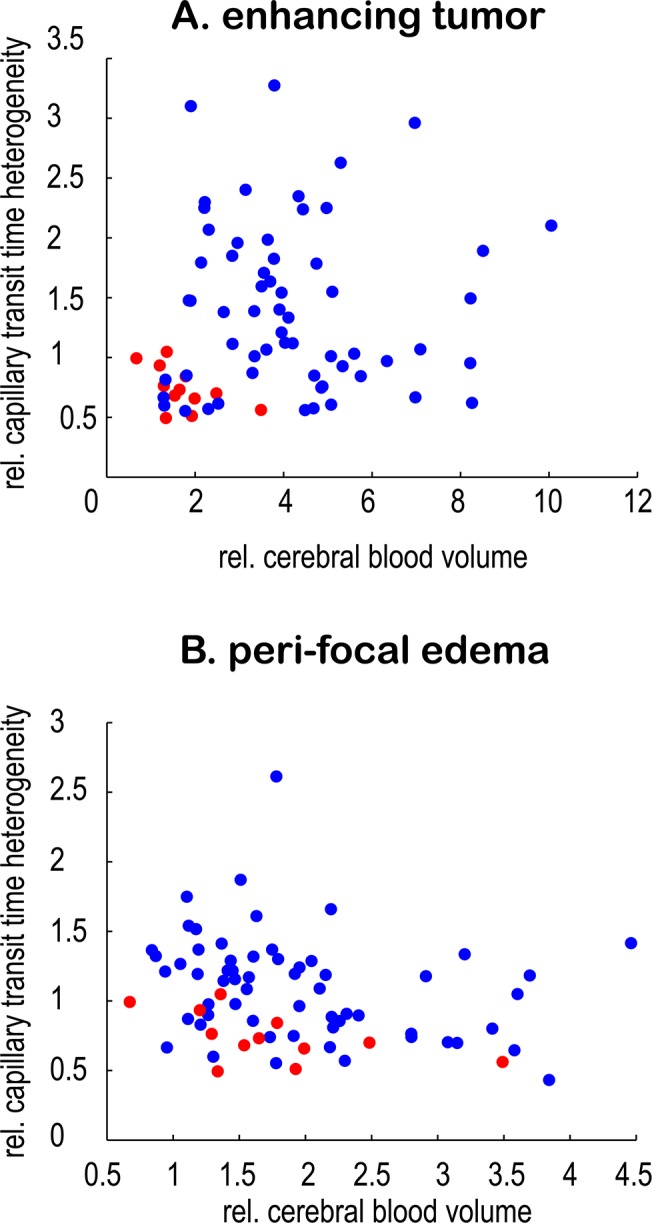
Fig 3. Correlation of rCBV and rCTH.

Scatterplots showing the very weak correlation of rCBV and rCTH in (A) the enhancing tumor (R2 = 0.01; p = 0.41) and (B) the peri-focal edema (R2 = 0.06; p = 0.05), suggesting that they provide different information. Mean values for each patient are plotted. High-grade gliomas are marked with blue, low-grade gliomas with red.
