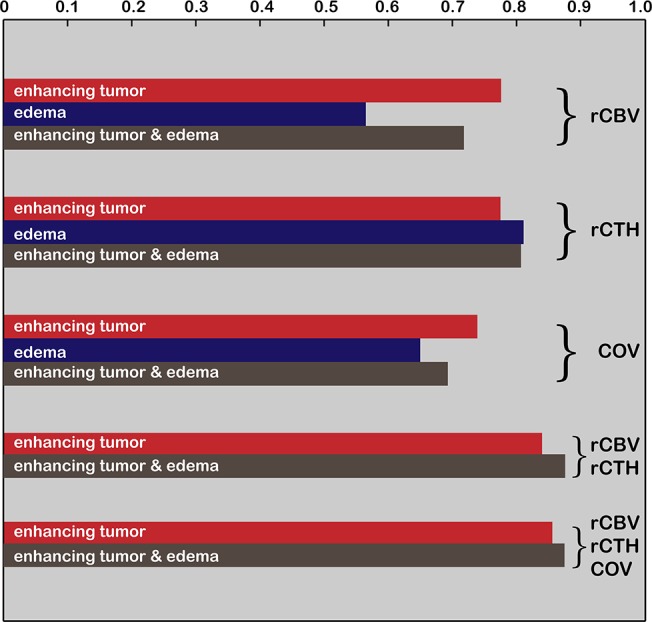
Fig 4. Accuracy for differentiating high-grade from low-grade gliomas.

The area under the curve as a measure for diagnostic accuracy is represented by bar length. Accuracy is calculated for single parameters (rCBV, rCTH, and COV) as well as for combinations of predictors, measured in the enhancing tumor (in red), the peri-focal edema (in blue), and a combined enhancing tumor/edema region (in brown).
