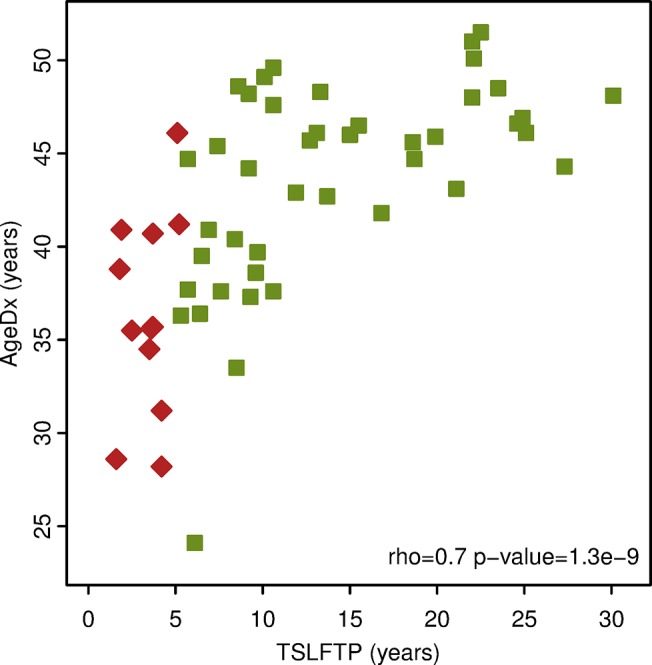
Fig 1. Ella sample case series.

The graph illustrates distribution of the time since the last full-term pregnancy and the age at diagnosis of the tumor sample case series utilized in the study. The x-axis is the time since last full-term pregnancy (TSLFTP) in years. The y-axis is the age at diagnosis (AgeDx) in years. Red diamonds represent Ella FFPE samples ≤ 5.2 years postpartum. Green squares represent Ella FFPE samples ≥ 5.3 years postpartum.
