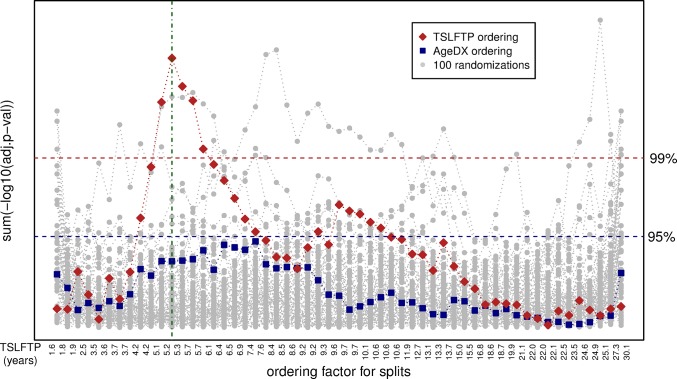
Fig 2. Exhaustive splitting of Ella samples.
Natural separation of the samples into two groups based on the time since the last full-term pregnancy (TSLFTP). Exhaustive splitting of the Ella FFPE case series was based either on TSLFTP, on age at diagnosis (AgeDX), or on randomized data. The x-axis represents individual splits based on each ordering factor. The y-axis represents the level of difference between the groups (sum of the negative log base 10 of the adjusted p-value) for each split. The red diamonds represent the differences after ordering based on TSLFTP. The TSLFTP for individual samples for this ordering is displayed at the bottom. The blue squares are based on ordering by AgeDX. Grey dots represent 100 randomized orderings. Blue and red horizontal dashed lines show the 95th and 99th percentile of the randomized data. Green vertical line indicates the split point with the largest difference between the groups based on TSLFTP.

