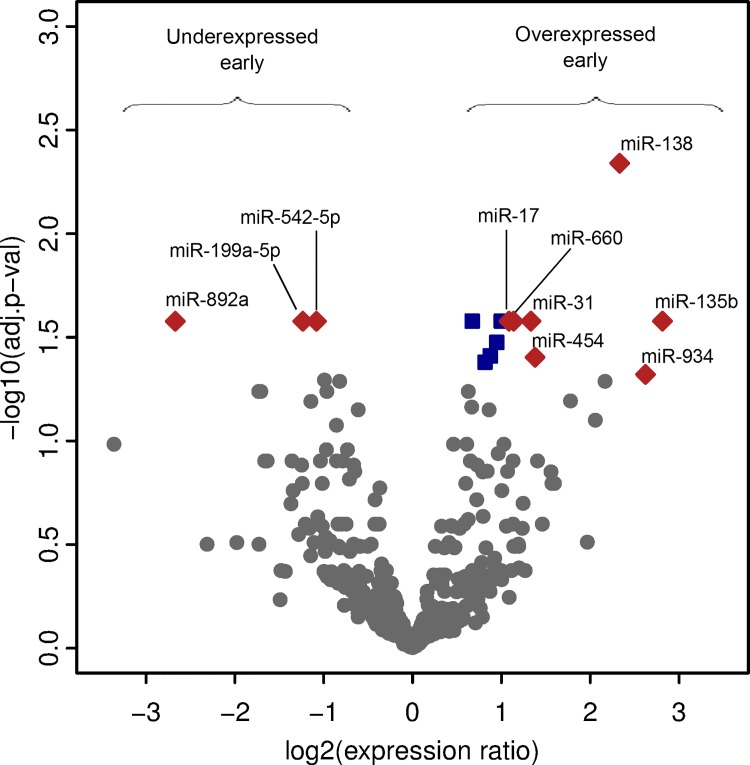
Fig 3. Volcano plot of differentially expressed miRNAs.
Comparing miRNAs expressed in Ella FFPE case series; early (diagnosed ≤ 5.2 years postpartum) and late (diagnosed ≥ 5.3 years postpartum). The x-axis represents the log base 2 of the miRNA expression ratio. The y-axis represents the negative log base 10 of the adjusted p-value. Red diamonds represent miRNAs meeting stringency cut-off (expression ratio ≥ 2-fold and an adjusted p-value < 0.05). Blue squares represent additional miRNAs with an adjusted p-value < 0.05. Gray dots represent the remaining miRNAs tested.

