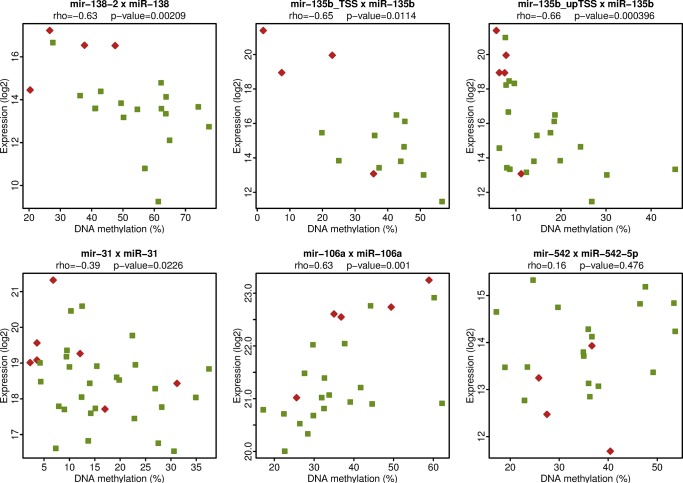
Fig 5. Linkage between miRNA expression and DNA methylation.
The x-axis shows the mean DNA methylation (%) of the miRNA Sequenom MassARRAY amplicons. The y-axis shows the miRNA expression levels as determined by quantitative RT-PCR analysis. The names of miRNA genes analyzed by MassARRAY and the names of the respective mature miRNA products detected by quantitative RT-PCR are displayed at the top of each plot. The Spearman correlation coefficient rho and the p-value (two-sided) of the correlation are displayed on the second line at the top of each plot.

