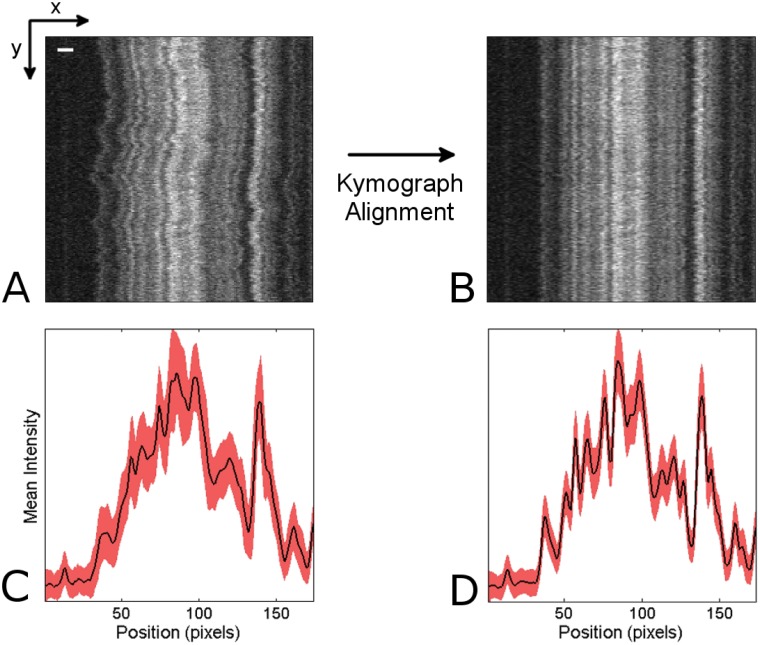
Fig 1. Problem definition.
(A) A raw kymograph depicting denaturation mapping of an intact T4GT7 bacteriophage DNA molecule. The y-axis represents time (200 time frames over 20 seconds) while the x-axis represents the DNA extension in the nanochannel (170 pixels wide; scale bar is 2μm). Note that these specifications also apply to all of the following kymographs. (B) The image from (A) after undergoing the kymograph alignment process. (C) Trace of mean intensity over time for the raw kymograph (black) with ±1 standard deviation (red), and (D) the same for the aligned kymograph.

