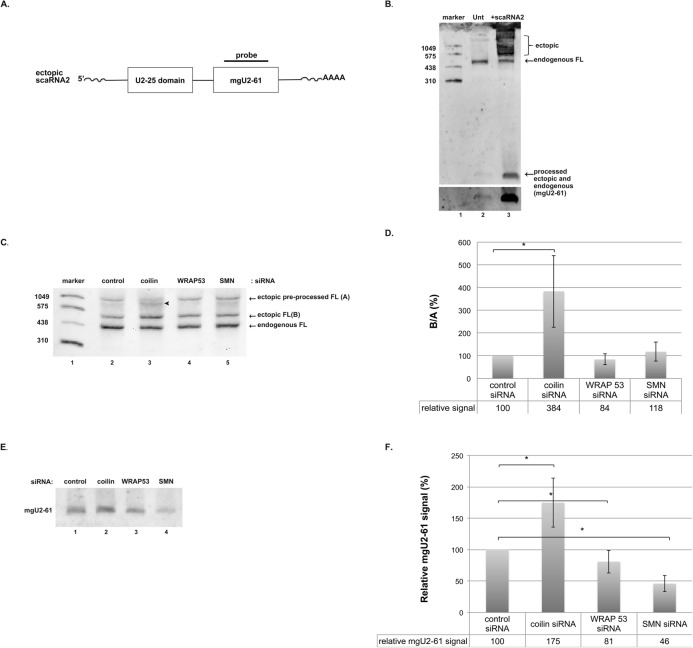
Fig 3. Reduction of coilin, WRAP53 or SMN dysregulates processing of ectopically expressed scaRNA2.
(A) Schematic showing ectopic pre-processed full-length scaRNA2 (expressed from the pcDNA3.1+ vector) and the locations of the U2-25 domain and the processed guide RNA (mgU2-61). A poly A tail, which does not exist for endogenous scaRNA2, is indicated. The probe used for Northern blots is also shown. (B) Northern blot of HeLa RNA (20 μg/lane) from either non-transfected cells (lane 2) or cells transfected (24 hr) with pcDNA 3.1+ scaRNA2 (lane 3). The probe used is shown in (A) The lower panel shows a longer exposure of the region of the gel with mgU2-61 signal in order to better visualize the endogenous signal. (C) Northern blot of Hela RNA (10 μg/lane) from cells transfected with control (lane 2), coilin (lane 3), WRAP53 (lane 4) or SMN (lane 5) siRNA for 24 hrs then transfected with pcDNA 3.1+ scaRNA2 for 24 hrs. The probe used is shown in (A). Ectopic pre-processed full-length (denoted as A), ectopic processed full-length (denoted as B) and endogenous full-length scaRNA2 is shown. An arrowhead marks an intermediate species often seen in RNA isolated from coilin knockdown cells (lane 3). (D) Histogram quantifying the ratio between ectopic processed full-length and ectopic pre-processed full-length (B/A) from 8 different experimental sets. Standard deviation was used to include error bars. Students t test was used to determine statistical significance, indicated by “*” and corresponding to a p value less than 0.05. (E) Northern blot of Hela RNA (20 μg/lane) from cells transfected with control (lane 1), coilin (lane 2), WRAP53 (lane 3) or SMN (lane 4) siRNA for 24 hrs then transfected with pcDNA 3.1+ scaRNA2 for 24 hrs. The Northern blotting transfer conditions were optimized to retain the smaller, mgU2-61 guide RNA. The probe used is shown in (A). The majority of the signal is coming from ectopically expressed mgU2-61 guide RNA. (F) Histogram quantifying the mgU2-61 guide RNA from 8 different experimental sets. The mobility of a DIG-labeled RNA marker (in nucleotides) is shown. Standard deviation was used to include error bars. Students t test was used to determine statistical significance, indicated by “*” and corresponding to a p value less than 0.05.

