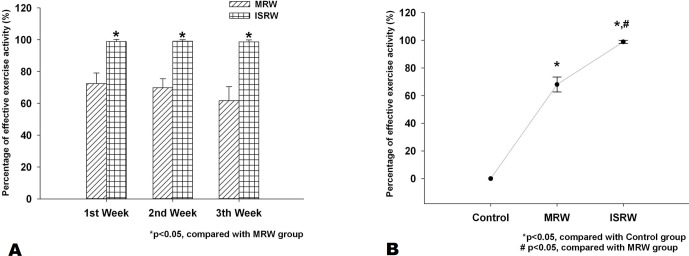
Fig 9. Comparing the percentage of effective exercise activity in the ISRW (n = 9) and MRW (n = 9) groups.

(a) The average effective exercise activity each week. (b) The average effective exercise activity at three weeks.

(a) The average effective exercise activity each week. (b) The average effective exercise activity at three weeks.