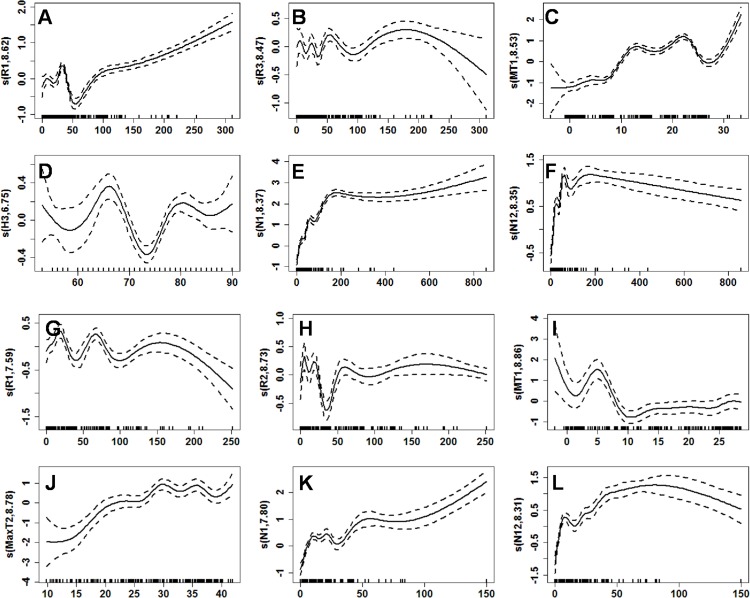
Fig 3. Curves of the smooth functions of each predictor variable in the GAM.
(A–F) Curves of smooth functions of each predictor variable in the 1971–1993 epoch, including R1, R3, MT1, H3, N1, and N12. (G-L) Curves of smooth functions of each predictor variable in the 1994–2012 epoch, including R1, R2, MT1, MaxT2, N1, and N12. The x-axis shows the value of each predictor variable, and the y-axis shows the value of each smooth function. The dashed line is the estimated 95% confidence interval. The vertical lines adjacent to the lower x-axis show the presence of data in the matching years. The numbers in the labels of y-axis denote the effective degrees of freedom. These plots demonstrate the complex non-linear relationship between HFRS cases and predictor variables.

