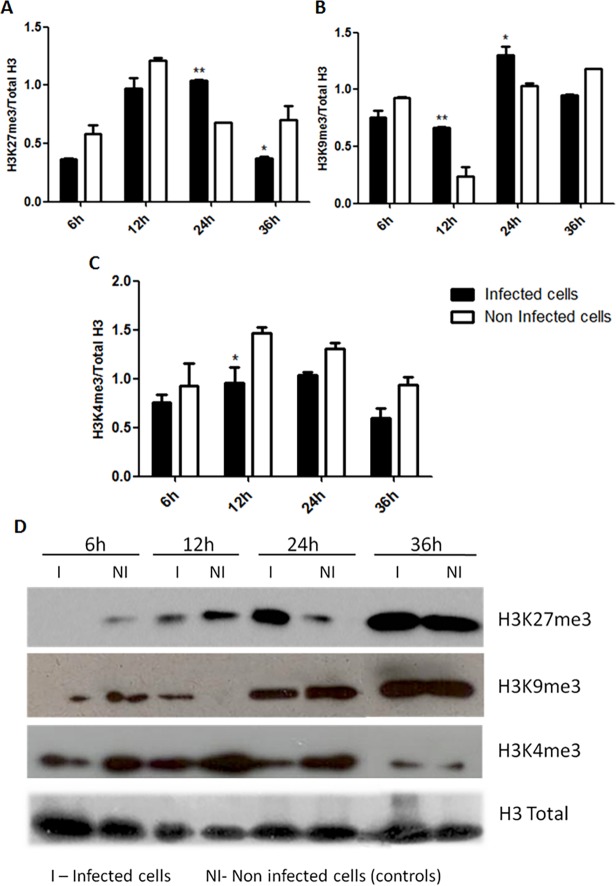
Fig 4. Classical markers of epigenetic transcriptional silencing and activation in activated PBMCs after HIV-1 infection.
(A) Graphical representation of protein ratios of epigenetic transcriptional silencing marker H3K27me3 over the total H3. (B) Graphical representation of protein ratios of epigenetic transcriptional silencing marker and H3K9m3 over the total H3. (C) Graphical representation of protein ratios of epigenetic transcriptional activation marker H3K4m3 over the total H3. Protein levels of each marker were calculated by the ratio of band intensities between specific markers (H3K27me3, H3K9me3 or H3K4me3) over the total H3 (normalizer) using the software ImageJ v. 1.45s (Public domain, NIH, USA). Dark bars—HIV-1 infected cells; White bars—non-infected cells (control group). (D) Representative Western blot image for each epigenetic marker (H3K27me3—upper panel, H3K9me3—middle panel, H3K4me3—lower panel and the total H3 as normalizer. The data represent the mean of three different measurements of the same experiment and the error bars indicate the differences between two independent experiments. 2way ANOVA: *** p< 0.001, ** p < 0.01 and *, p < 0.05. (NI) non-infected cells, (I) HIV-1 infected cells.

