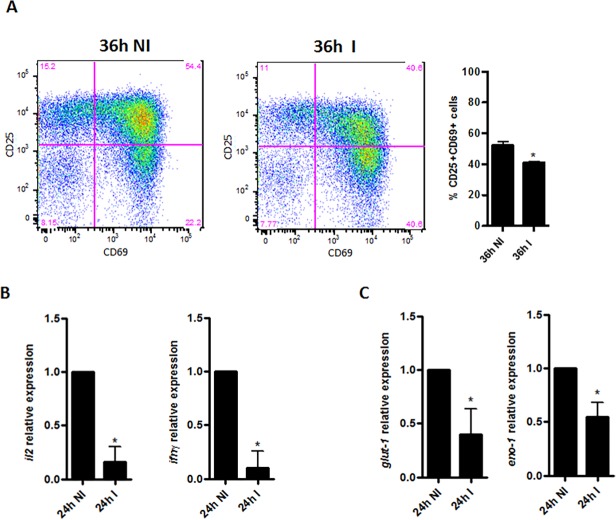
Fig 5. Modulation in the functional markers of activated CD4+ T cells after HIV-1 infection.
(A) Flow cytometry of purified CD4+ T cells at 36h post HIV-1 infection—dot plots of cell populations (gated on CD4+CD3+ cells) analyzed for the T cell early activation markers CD25, CD69 (percentages are shown in each quadrant) and graphical representation of the percentages of CD25+CD69+ cells (gated on CD4+CD3+ cells). (B) IL2 and IFN- γ mRNA relative expression in CD4+ T cells at 24h after HIV-1 infection. (C) GLUT-1 and ENO-1 mRNA relative expression in CD4+ T cells at 24h after HIV-1 infection. GAPDH was used as a normalizer of all reactions to calculate the relative expression by 2-ΔΔCt method. Data are shown as mean ± SD of triplicates and are representative of three independent experiments using cells of three different healthy donors. Two-tailed Student’s t-test: *, p < 0.05. (NI) non-infected cells, (I) HIV-1 infected cells.

