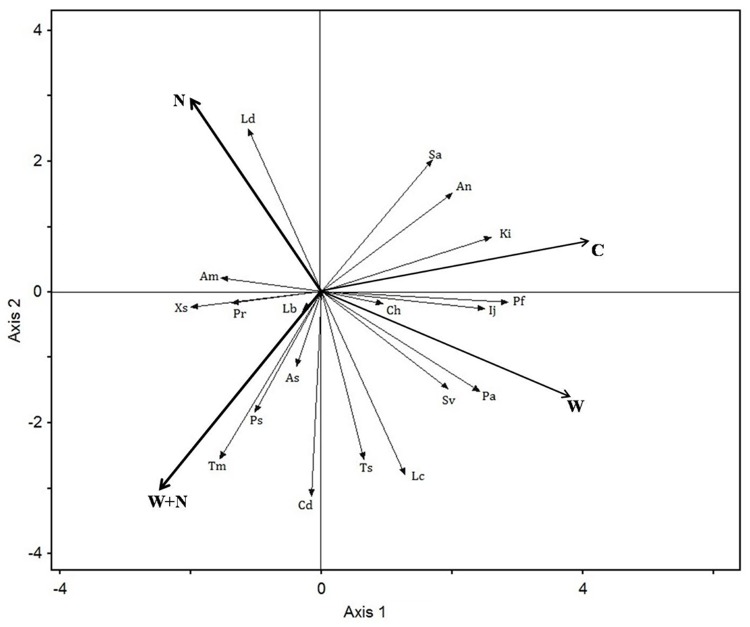
Fig 3. Ordination diagram showing the result of the redundancy analysis (RDA) of the plant community composition.
C represents control; N represents N addition treatment; W represents warming treatment; W+N represents warming plus N addition treatment. See Table 1 for abbreviations of the species names.

