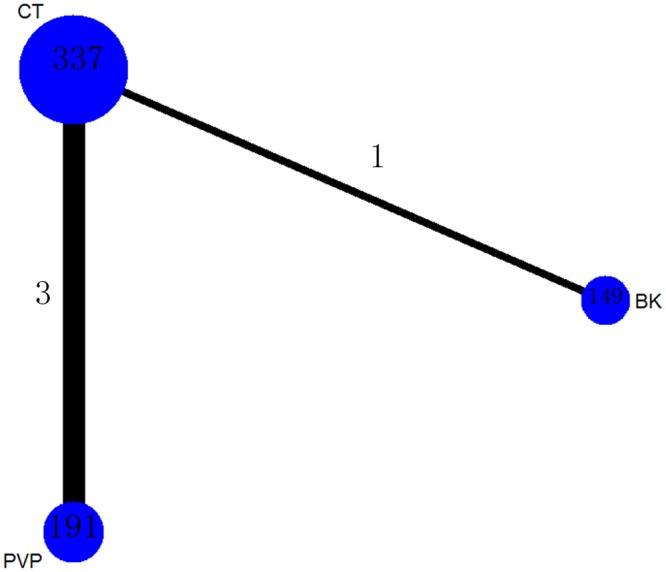
Fig 6. Network of treatment comparisons for risk of all-cause discontinuation.

The network plot shows direct and indirect comparisons. The size of the nodes represents the total sample size of treatments. The lines’ thickness corresponds to the number of trials that compare each other. PVP: Percutaneous vertebroplasty; BK: Balloon kyphoplasty; CT: Conservative treatment.
