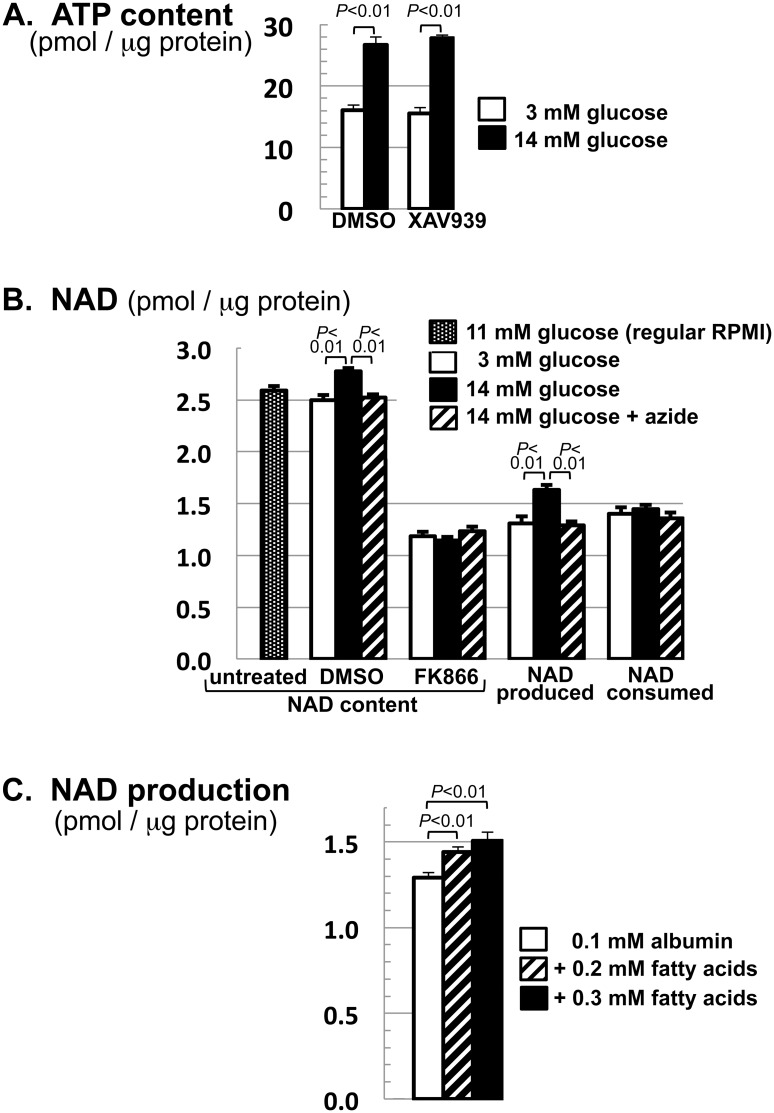
Fig 2. Glucose and fatty acids increase NAD+ production in INS-1 cells.
A. Cells were treatment with 3 or 14 mM glucose in the presence of XAV939 (4 μM) or DMSO for 7 hr. ATP content was determined as described in Materials and Methods and normalized to protein content. B. Cells were grown to confluence in regular RPMI (11 mM glucose). For each 12-well plate, 2 wells served as untreated controls while the remainder were switched to fresh RPMI containing the indicated combination of glucose (3 or 14 mM), FK866 (0.2 μM), DMSO, and sodium azide (0.8 mM). Cells were lysed 7 hr later for NAD+ analysis. NAD+ contents (shown in the first 7 bars) were used to calculate the amount of NAD+ produced vs. consumed during the 7-hr treatment (shown in the last 6 bars) using the formula described in Materials and Methods. C. Cells were treated for 6 hr with 0, 0.2 or 0.3 mM fatty acids (a 2:1 mixture of linoleic acid and oleic acid) in the presence of 0.1 mM albumin and 3 mM glucose. NAD+ production during the treatment was determined as in B. Data shown (mean ± S.E.M.) are representative of 4 (A-B) or 2 (C) independent experiments.

