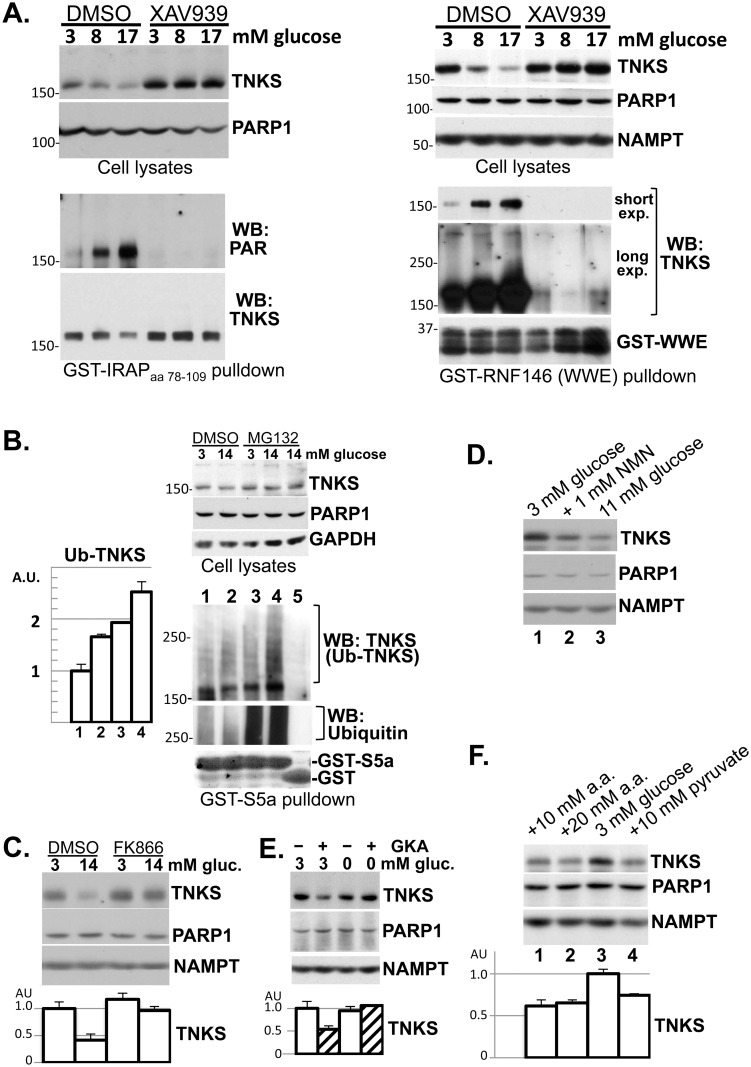
Fig 3. Diverse fuels promote TNKS autoPARsylation and turnover in INS-1 cells.
A. Left panels: Cells were pretreated with XAV939 (4 μM) or DMSO in the presence of 3 mM glucose for 30 min before glucose was raised to the indicated final concentration for 5 hr. Equal aliquots of the lysates were immunoblotted (upper panels). TNKS in the remaining lysates was precipitated by incubation with resins of GST-IRAPaa78-109 (15 μg), which contained a hexapeptide sequence (IRAPaa96-101) that bound to the ANK domain of TNKS [49]. The precipitates were immunoblotted sequentially for PAR and TNKS. Each lane corresponds to a 15-cm plate. The data shown are representative of 2 independent experiments. Right panels: Cells were treated for 7 hr with the indicated glucose concentration in combination with either XAV939 (4 μM) or DMSO. Equal aliquots of the lysates were immunoblotted (upper panels). PARsylated species in the remaining lysates were precipitated by incubation with resins of GST fused to the WWE domain of RNF146 (20 μg) and immunoblotted for TNKS (two exposures) and RNF146 (lower panels). Each lane corresponds to a 10-cm plate. The data shown are representative of 4 independent experiments. B. Cells were treated with 3 or 14 mM glucose for 30 min before MG-132 (10 μM) or vehicle (DMSO) was added for another 30 min. Equal aliquots of the lysates were immunoblotted (upper panels). Ubiquitinated species in the remaining lysates were precipitated by incubation with resins of GST fused to the ubiquitin-binding motifs of S5a (20 μg, lanes 1–4), using GST as negative control (20 μg, lane 5). The precipitates were sequentially immunoblotted with anti-TNKS antibodies to detect ubiquitinated TNKS, and with anti-ubiquitin antibodies for loading control. The bar graph shows densitometer analysis of ubiquitinated TNKS (mean ± SEM; n = 3). The data shown are representative of 2 independent experiments. C. Cells were treated with FK866 (0.2 μM) or DMSO in the presence of 3 or 14 mM glucose. D. Cells were treated with 3 mM glucose (lane 1), 1 mM NMN in combination with 3 mM glucose (lane 2), or 11 mM glucose (lane 3). E. Cells were treated with the indicated concentration of glucose along with a glucokinase activator (GKA, 10 μM RO-28-1675 [50]) or DMSO. F. Cells were treated with 3 mM glucose, either alone (lane 3) or in combination with alanyl-glutamine (10 mM in lane 1; 20 mM in lane 2) or pyruvate (10 mM, lane 4). For C-F, the treatment duration was 6–8 hr. Each lane represents 10% of whole-cell extracts from a well in 24-well plates. The immunoblots are representative of 2–3 experiments, each performed in 2–4 replicates. The bar graphs show densitometer quantification of TNKS abundance (mean ± SEM).

