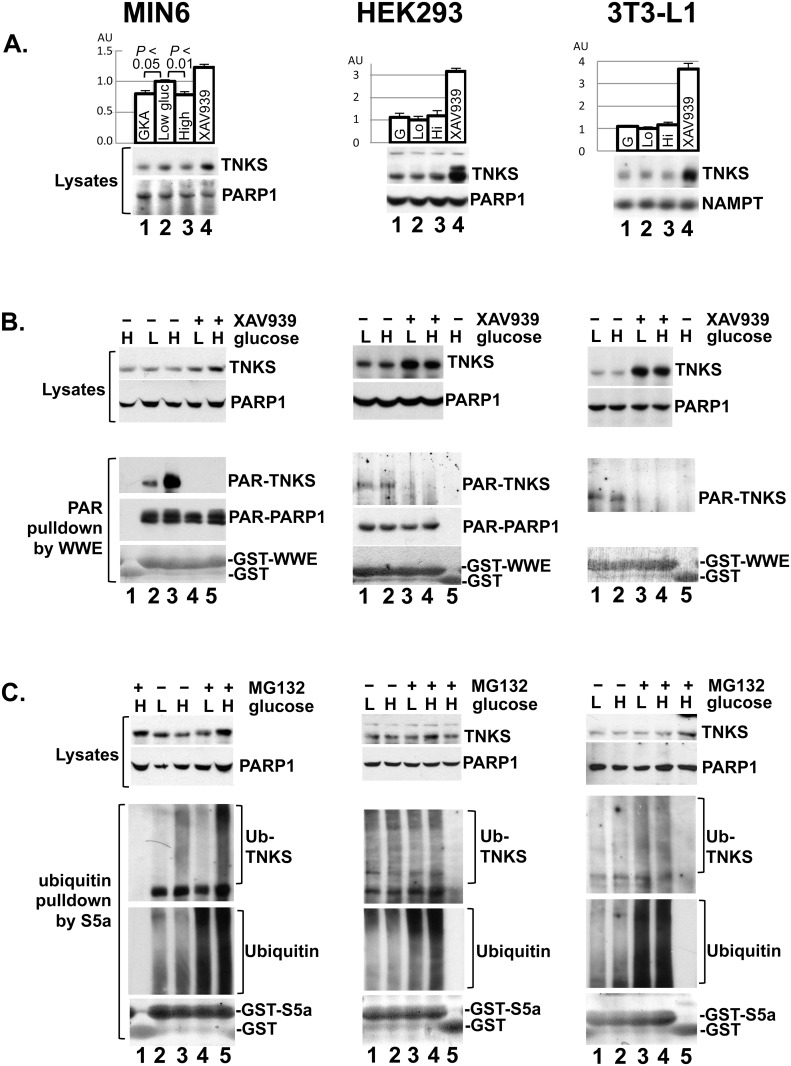
Fig 4. Cell-type specificity of the glucose effects on TNKS.
A. Confluent cultures of mouse MIN6 insulinoma cells, human HEK293 renal epithelial cells, and mouse 3T3-L1 preadipocytes were treated in 24-well plates for 7 hr with glucokinase activator (10 μM GKA, lane 1) in 3 mM glucose, 3 mM glucose alone (lane 2), 14 mM glucose (lane 3), or XAV939 (4 μM, lane 4) in 3 mM glucose. Whole-cell extracts representing 10% of each well were immunoblotted for the indicated proteins. The immunoblots are representative of 2 independent experiments, each performed in 4 or 6 replicates per condition. The bar graphs indicate densitometer analysis of TNKS abundance (mean ± S.E.M). B. Confluent cultures of the indicated cell types were treated for 7 hr with 3 or 14 mM glucose as indicated by L (low) or H (high) in combination with XAV939 (4 μM) or DMSO. Lysates were incubated with GST as controls (lane 1 for MIN6; lane 5 for HEK293 and 3T3-L1) or with GST-WWE (15 μg, the remaining lanes) to precipitate PARsylated species as in Fig 3A. Lysates (upper panels) and the precipitates (lower panels) were immunoblotted for TNKS and PARP1. The precipitates were also Coomassie-stained for GST fusion proteins. Each lane represents a 15-cm plate (10 cm for MIN6 cells). PARsylated PARP1 was not detectable in 3T3-L1 cells. The data are representative of 2 or 3 experiments. C. Cells were treated with 3 (L) or 14 mM (H) glucose for 30 min before MG-132 (10 μM) or DMSO was added for another 30 min prior to harvesting for ubiquitination analysis as in Fig 3B. Each lane represents a 10-cm plate. The data are representative of 2 experiments, each performed in triplicate.

