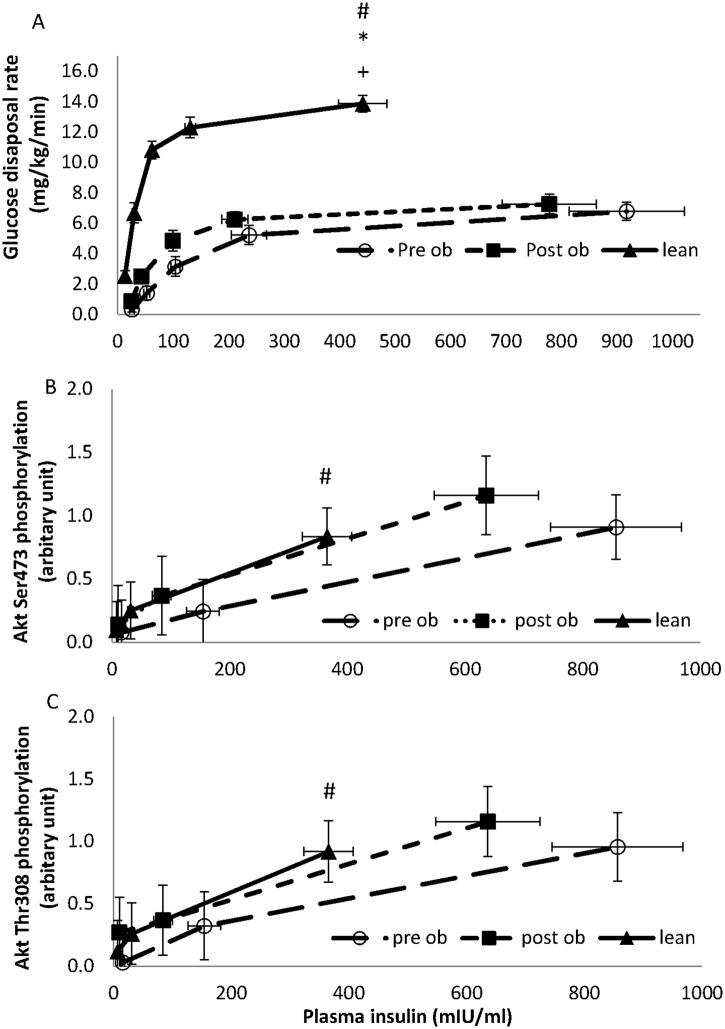
Fig 2. Summary of glucose disposal rates and insulin signalling in lean and obese volunteers, pre and post weight loss surgery.
A comparison of glucose disposal (panel A), phosphorylation of Akt on Thr308 (panel B), phosphorylation of Akt on Ser473 (panel C) and phosphorylation of PRAS40 on T426 (panel D) between lean (filled triangles) and obese volunteers before (open circles; pre-op) and after (filled squares; post-op) surgery. The glucose disposal was measured during a 10 hour hyperinsulinaemic euglycaemic clamp with insulin infusion rates of 0.2, 0.5, 1, 2 and 5 mU kg-1 min-1. Data points represent the mean ± SEM with the glucose disposal plotted against the mean insulin concentration achieved at each insulin infusion rate.

