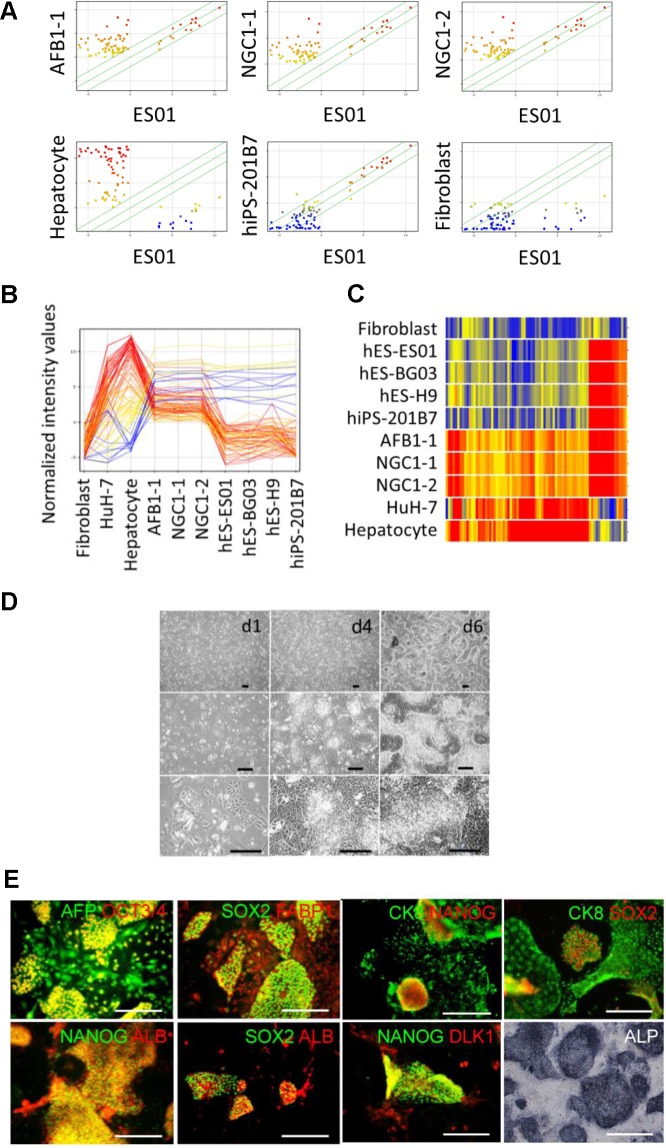
Fig 1. Established hiHSCs express markers of both ESCs and hepatocytes.
(A, B, C) The gene expression of established hiHSCs was analyzed by DNA microarray. Shown are data characterized by (A) scatter plots, (B) profiling plots, and (C) a heat map of the expression profiles of embryonic stem cell (ESC)- and hepatocyte-enriched genes to compare hiHSCs (clones AFB1-1, NGC1-1, and NGC1-2) with fibroblasts, human ESCs (ES01, BG03, and H9), hiPSCs (201B7), a hepatocellular carcinoma cell line (HuH-7), and human adult hepatocytes. Normalized fluorescent intensity values range from red (high) to blue (low) coloring. Scatter plots are colored by the values of cell samples along the Y-axis. Profiling plots are colored by the values of hepatocytes. All three of the clones exhibit unique gene expression profiles expressing both hESC-enriched genes and hepatocyte-enriched genes distinct from fibroblasts, ESCs, hiPSCs, HuH-7, and hepatocytes. See also S2, S3, and S4 Figs. (D) Phase contrast micrographs showing the morphology of hiHSCs (clone AFB1-1) at days 1, 4, and 6 after passage. Scale bar represents 100 μm. See also S5 Fig. (E) Staining of immunocytochemistry and alkaline phosphatase (ALP) activity of hiHSCs (clone AFB1-1). Immune double-staining confirms the co-expression of ESC-specific transcription factors (OCT3/4, SOX2, and NANOG) and hepatocyte-marker proteins (AFP, FABP1, ALB, CK8, and DLK1). ALP activity was stained with violet coloring. Scale bar represents 100 μm. See also S7, S8, S9, and S10 Figs.

