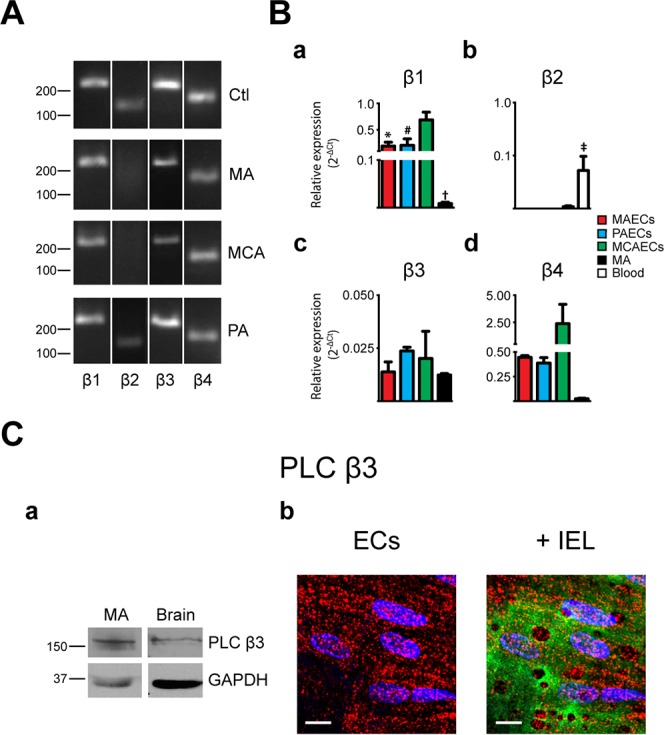
Fig 1. Characterization of phospholipase C β isoforms in native arteries.

A. The presence of mRNA for phospholipase C (PLC) β isoforms was determined in mesenteric arteries (MA), pulmonary arteries (PA) and middle cerebral arteries (MCA) by PCR. Typical agarose gel electrophoresis of the PCR products showed the expression profile in different vascular beds. Brain and blood were used as positive control tissues. n = 3. B. Quantitative real time PCR analysis of mRNA expression levels of PLCβ isoforms in MA and freshly isolated endothelial cells (ECs) from MA, PA and MCA. Bar graphs show the expression profile of PLCβ1 (a), β2 (b), β3 (c) and β4 (d) isoforms in MAECs, PAECs, MCAECs, MA and blood as control for β2. n = 3. * P<0.05 between MAECs and MCAECs; # P<0.05 between PAECs and MCAECs; † P<0.05 between MCAECs and MAs; ‡ P<0.05 between control tissue and MA. C. (a) Representative immunoblots of murine MA and brain that were obtained using the primary antibody anti-PLC β3 (Abcam #ab52199). GAPDH was used as reference protein. Relevant molecular weight markers are indicated on the left. n = 3. (b) Intracellular distribution of PLCβ3 immunoreactivity in ECs. (Left) Typical image showing labelling of PLC β3 in red and nuclei in blue; scale = 10 μm. (Right) Labelling of PLC β3 (red) overlay with internal elastic lamina (IEL; green) where voids correspond to potential myoendothelial projections; nucleus in blue; scale = 10 μm; n = 4.
