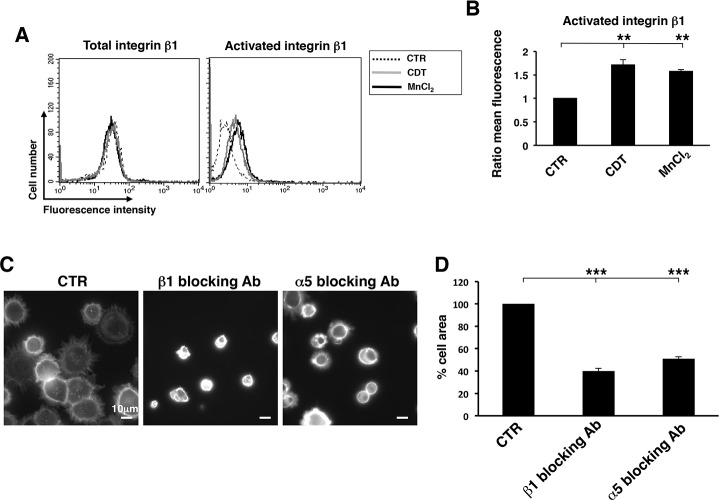
Fig 4. CDT intoxication promotes activation of β1 integrin.
A. HeLa cells were seeded, and further left untreated (dotted line), intoxicated with CDT (1μg/ml, grey line) for 6h, or treated with 2 mM MnCl2 as described in Material and Methods (black line). Expression of the integrin β1 total levels (left panel) or its activate form (right panel) was assessed by FACS analysis. B. Quantification of the activated form of integrin β1. The data are presented as ratio between the mean fluorescence intensity of the intoxicated or MnCl2-treated cells and the mean fluorescence intensity of the untreated cells. Mean ± SEM of 5 independent experiments. Statistical analysis was performed using the Student t-test. ** p value < 0.01. C. Cell adhesion/spreading assay was performed on HeLa cells left untreated or intoxicated with CDT for 6h prior detachment with 2.5 mM EDTA in PBS. Before adhesion on fibronectin-coated glasses, cells were incubated for 30 minutes with the rat monoclonal antibody 13 directed against integrin β1 or mouse monoclonal antibody P1D6 directed against integrin α5. As control, cells were incubated with normal rat or mouse serum (CTR). The figure shows representative micrographs where the actin cytoskeleton is visualized by phalloidin staining. D. Quantification of the cell spread was performed as described in Fig 1. Data are presented as percentage of the cell area relative to the cells pre-incubated with the normal rat or mouse serum. Mean ± SEM of three independent experiments. Statistical analysis was performed using the Student t-test. *** p value < 0.001.

