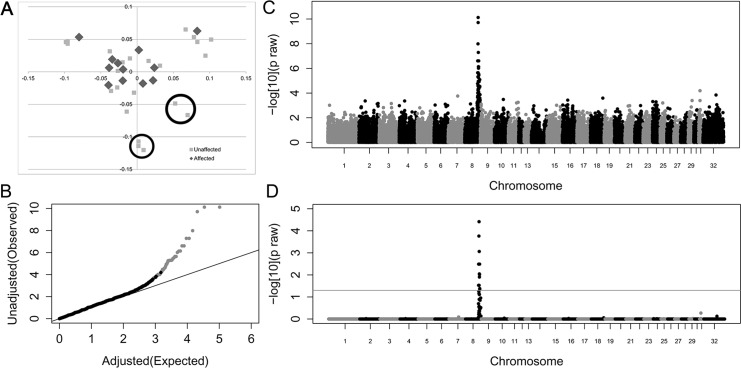
Fig 2. Genome-wide case-control allelic association study results of Connemara ponies with HWSD (15 cases, 24 controls).
(2A) Multi-dimensional scaling plot. Controls circled contributed most to genomic inflation and were removed from analysis (2B). Quantile-Quantile plot of genome-wide association results after removing 7 control ponies. Grey dots represent the observed versus expected p-values of all SNPs. Black dots represent the observed versus expected p-values after removal of all SNPs on chromosome 8. The solid grey line represents the null hypothesis: observed p-values equal expected p-values. (2C) Manhattan plot of—log10 of raw p-values by chromosome. The lowest p-values are on chromosome 8. (2D) 52K Max (T) permutation results. The line that parallels the X axis denotes genome-wide significance (p<0.05;-log10 >1.3).

