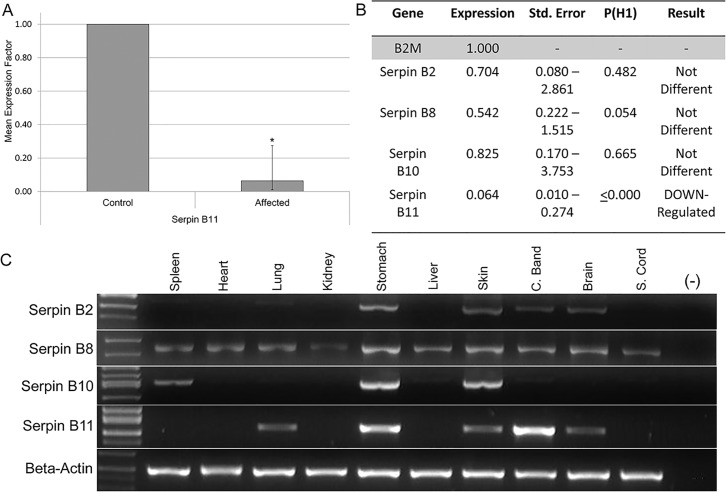
Fig 4. Expression analysis of SERPINB2, SERPINB8, SERPINB10 and SERPINB11.
(4A) Relative SERPINB11 gene expression ratio of coronary band cDNA from four HWSD-affected Connemara ponies compared to four unaffected horses. Relative expression levels were normalized to the housekeeping gene B2M. Statistical significance is reported as p<0.001(*). B. Relative SERPINB2, B8, B10, and B11 gene expression levels in four affected Connemara ponies, compared to four unaffected horses and normalized to the housekeeping gene B2M. P(H1) = Probability of alternate hypothesis that difference between sample and control groups is due only to chance. P(H1) is significant (p<0.05) for only SERPINB11. C. Gel image of PCR amplification of SERPINB2, B8, B10, and B11 from spleen, heart, lung, kidney, stomach, liver, skin, coronary band, and spinal cord cDNA of an unaffected horse. Beta-actin was used to control for cDNA concentrations.

