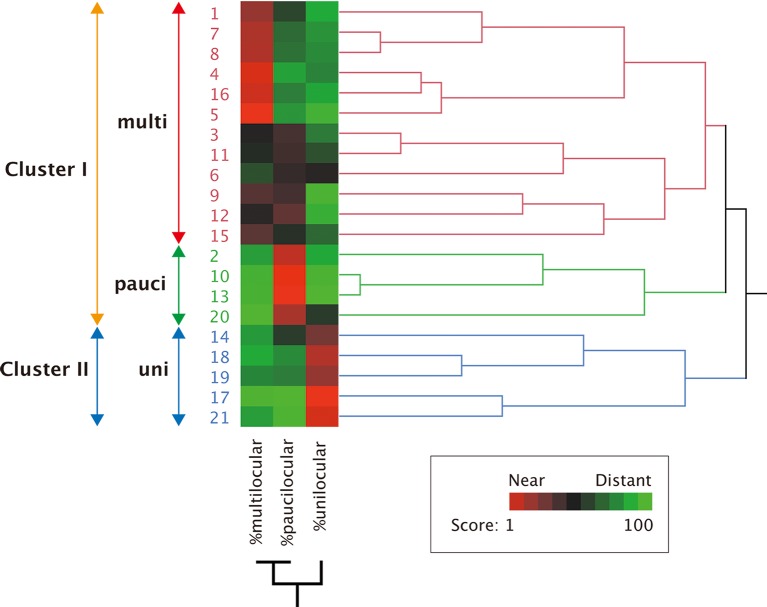
Fig 2. Hierarchical clustering according to BAC cellularity.
Summary of hierarchical clustering analysis of the immunohistochemical data of 21 UCP1-positive cases. The number and the word represent the individual case and each cellularity, respectively. The arrows show the range of the same cluster. Further, the branch length represents the similarity between results obtained in this system. UCP1-positive cases in the present study were classified into three groups according to the results: multi, the multilocular-dominant group; pauci, the paucilocular-dominant group; uni, the unilocular-dominant group. Cluster I comprised multi and pauci, Cluster II was equal to uni. %multilocular, percentage of area occupied with the multilocular cells; %paucilocular, percentage of area occupied with the paucilocular cells; %unilocular, percentage of area occupied with the unilocular cells. The score of the heat map in the lower right box represents the normalized distance among parameters.

