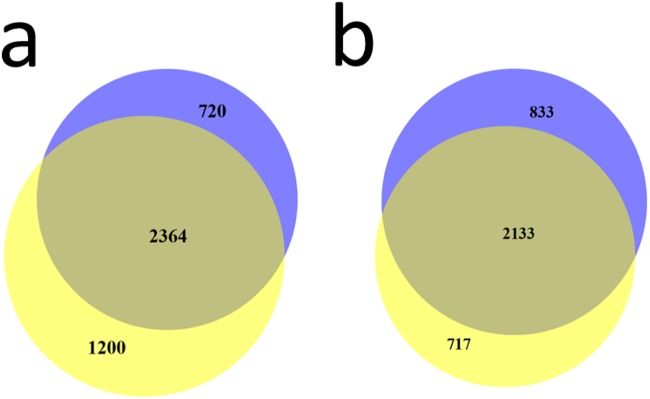
Fig 5. Venn diagrams for a) fractionated approach and b) unfractionated approach.

Proteins seen in the “pigmentation” (blue color) sample subset vs those seen in the “high-immune” (yellow color) sample subset.

Proteins seen in the “pigmentation” (blue color) sample subset vs those seen in the “high-immune” (yellow color) sample subset.